2025 AIChE Annual Meeting
(372i) Low-Carbon Manufacturing Can Increase the Climate Benefit of Photovoltaics By up to 208% Points
Authors
I. INTRODUCTION
The transition from fossil to renewable energy sources is a key lever to mitigate greenhouse gas (GHG) emissions and restrict global temperature to below 1.5°C above pre-industrial levels. Yet growth trajectory and predicted ultimate scale could lead to PV becoming one of the largest global industries with enormous annual GHG emissions from manufacturing, even while lowering carbon emissions compared to the incumbent energy sources they displace. Prior studies have calculated a payback time for those upfront GHG emissions. While simple to calculate and communicate, the usefulness of the payback time and similar metrics are limited because they treat all GHG emissions as equal no matter when emitted, and yet we know there is greater impact on climate from emissions earlier within a given timeframe. Herein we will demonstrate how low carbon manufacturing, even for an already low carbon energy source like PV, can yield significant additional climate benefits, as measured by reduced future temperature change.
Temperature increase resulting from GHG emissions can be quantified by the absolute global warming potential (AGTP)1 metric. The AGTP1 metric reveals that the temperature-increase caused by a GHG emission pulse is directly proportional to the lifetime of the GHG in the atmosphere. Consequently, emission of a GHG occurring earlier in a given timeframe will remain longer within that timeframe and, thereby, induce a greater temperature increase than an equal mass of GHG emitted later in that timeframe. If a societal goal is to reduce future temperature increase, earlier GHG emission reductions (e.g., in the manufacturing stage of a technology’s life cycle) are of higher value than later.
II. RESULTS
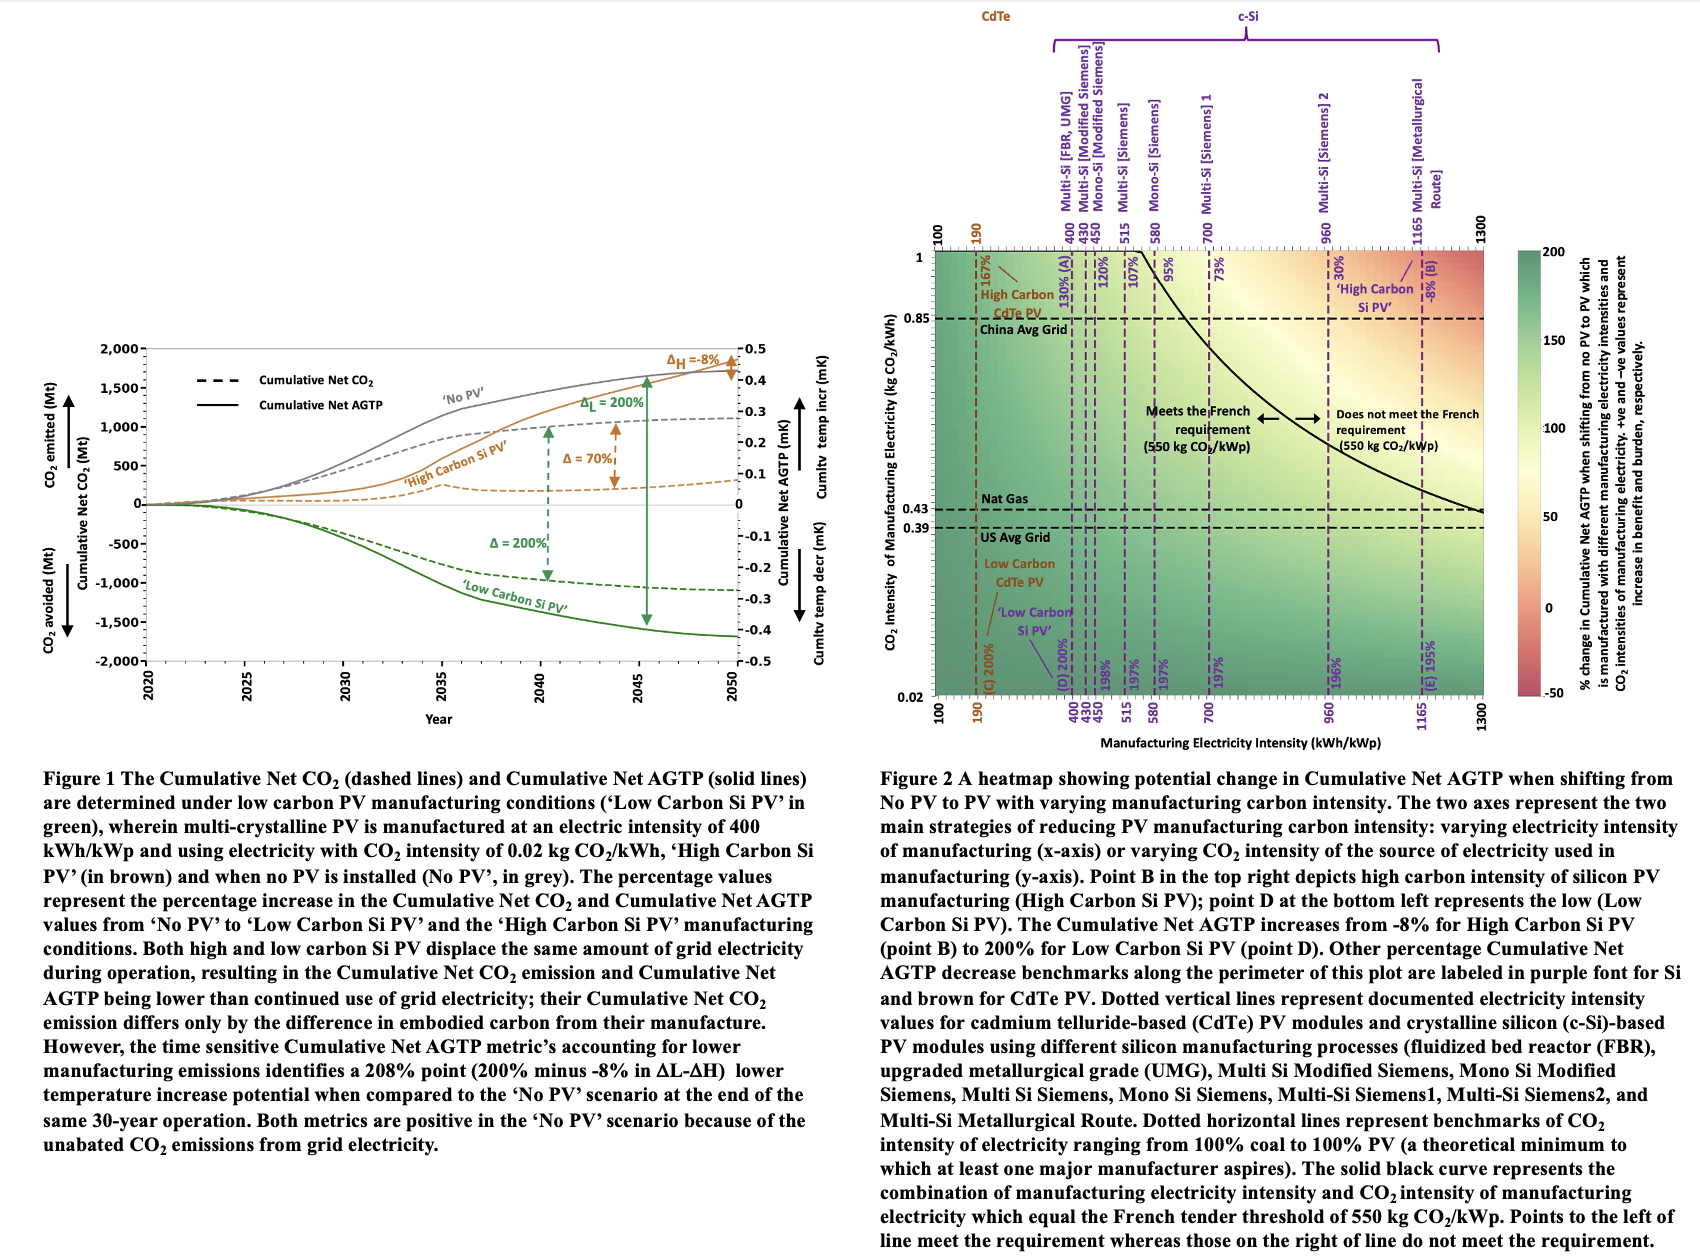
In Figure 1 we contrast the results of a simple mass accounting of emissions (net CO2 emissions) to a time-sensitive, net AGTP accounting for the illustrative case of 1.2 TWp of PV being manufactured (positive emissions) and then installed and operated over 30 years, hypothetically displacing generation and emissions from the average US grid. Only the carbon intensity of manufacturing PV differs, which is shown using the highest (hereafter, high-carbon PV) and lowest (hereafter, low-carbon PV) cases found in empirically-derived literature estimates today.
Whereas there is a 70% point difference (200% minus 130%) in Cumulative Net CO2 emissions between low and high carbon PV after 30 years of operation, use of the time-sensitive Cumulative Net AGTP metric reveals that low-carbon manufactured PV can lead to 208% percentage point (200% minus -8%) lower net future temperature increase compared to high-carbon PV. Using a time-sensitive climate metric thus demonstrates that lower carbon manufacturing is much more effective at yielding the result society desires – reduced future temperature increase – than deployment of high carbon PV.
There are two broad approaches to achieve lower manufacturing carbon intensity in the context of a product like PV whose manufacturing-related GHG emissions are mainly from consumed electricity: (1) decreasing the electricity consumed per unit product, and (2) utilizing less CO2 intensive sources of electricity. Figure 2 presents the potential increase in Cumulative Net AGTP achieved by each of these approaches as compared to the highest embodied-carbon PV module (‘High Carbon Si PV’, top right corner). The first approach corresponds to moving from right to left in the heatmap, and the second corresponds to moving downward.
III DISCUSSION
The results in Figure 2 offer four key insights. First, moving from ‘No PV’ to PV whose manufacturing is decarbonized through both the approaches - decreasing electricity intensity of PV manufacturing and shifting to less CO2 intensive sources of electricity – will generate significant increases in the Cumulative Net AGTP, even if pursued alone. The increase in Cumulative Net AGTP for the former is 138% points (130% minus -8% when moving right from point A to B) and the latter is 203% points (195% minus -8% when moving up from point E to B).
Second, the choice of PV technology has significant influence on Cumulative Net AGTP. The electricity intensity of CdTe module manufacturing has been documented at 190 kWh/kWp versus 400 to 1165 kWh/kWp for c-Si. However, the incremental Net AGTP Benefit from CdTe progressively diminishes when less CO2-intensive sources of electricity are used in c-Si manufacturing. For example, the Cumulative Net AGTP from CdTe is equal to c-Si when, for instance, PV electricity is used in manufacturing either CdTe or c-Si (i.e., 200% versus 200% when moving right from point C to E). The diminishing returns can be attributed to the fact that if the electricity used in PV manufacturing is very low in CO2 intensity then the amount of electricity consumed in manufacturing will matter less and the resulting upfront manufacturing CO2 emissions will have not have a significant impact on the Cumulative Net AGTP.
Third, a c-Si PV manufacturer can increase the Cumulative Net AGTP by up to 138 percentage points by choice of polysilicon manufacturing process (point A to B), which has been shown to be the most energy intensive material component in a PV module. The electricity intensity of SG Silicon varies by a factor of 3 from 1165 kWh/kWp (Metallurgical Route, point B) to 400 (FBR, UMG, point A). There is no variation observed for CdTe as one firm dominates the CdTe manufacturing market.
Fourth, most of the empirically bound region of the heatmap meet the French tender requirements. Due to the low electricity intensity of manufacturing, CdTe PV modules and c-Si PV modules containing SG Si sourced from UMG or FBR pathways will meet the tender requirements regardless of the CO2 intensity of the manufacturing electricity. However, when SG Si is sourced from Siemens or the modified Siemens pathway, the ability of the c-Si PV module to meet the French tender is dependent on the electricity intensity of manufacturing, which shows significant variation in the literature. It is important to note that Siemens and modified Siemens are dominant technologies and account for 90% of the global SG Si market. As a result, further research is required to assign prevalence to the two regions of the graph based on the market shares of the major global PV manufacturers and PV technology types which are compliant and noncompliant with the French requirements.
References
(1) Myhre, G.; Shindell, D.; Bréon, F.-M.; Collins, W.; Fuglestvedt, J.; Huang, J.; Koch, D.; Lamarque, J.-F.; Lee, D.; Mendoza, B.; et al. 2013: Anthropogenic and Natural Radiative Forcing Supplementary Material. In: Climate Change 2013: The Physical Science Basis. Contribution of Working Group I to the Fifth Assessment Report of the Intergovernmental Panel on Climate Change. 2013.