2024 AIChE Annual Meeting
(234f) Statistical Analysis of Processes Using Data Provided By the PI System (AVEVA/OSISoft)
Authors
In this context, the use of software that has the capacity to store and provide access to a large amount of data, collected in real time, for use in the development of the statistical analysis environment in Python and the predictive model is mandatory. Then, the PI System, software from AVEVA/OSIsoft, emerges as a valuable tool for this process, providing capabilities for data acquisition, visualization, and analysis. On this way, the main objective of this project is the development of a Python-based tool for statistical analysis of processes, using data from the PI System (AVEVA/OSIsoft), and expanding its usability through a predictive model for quality control based on Statistical Process Control (SPC).
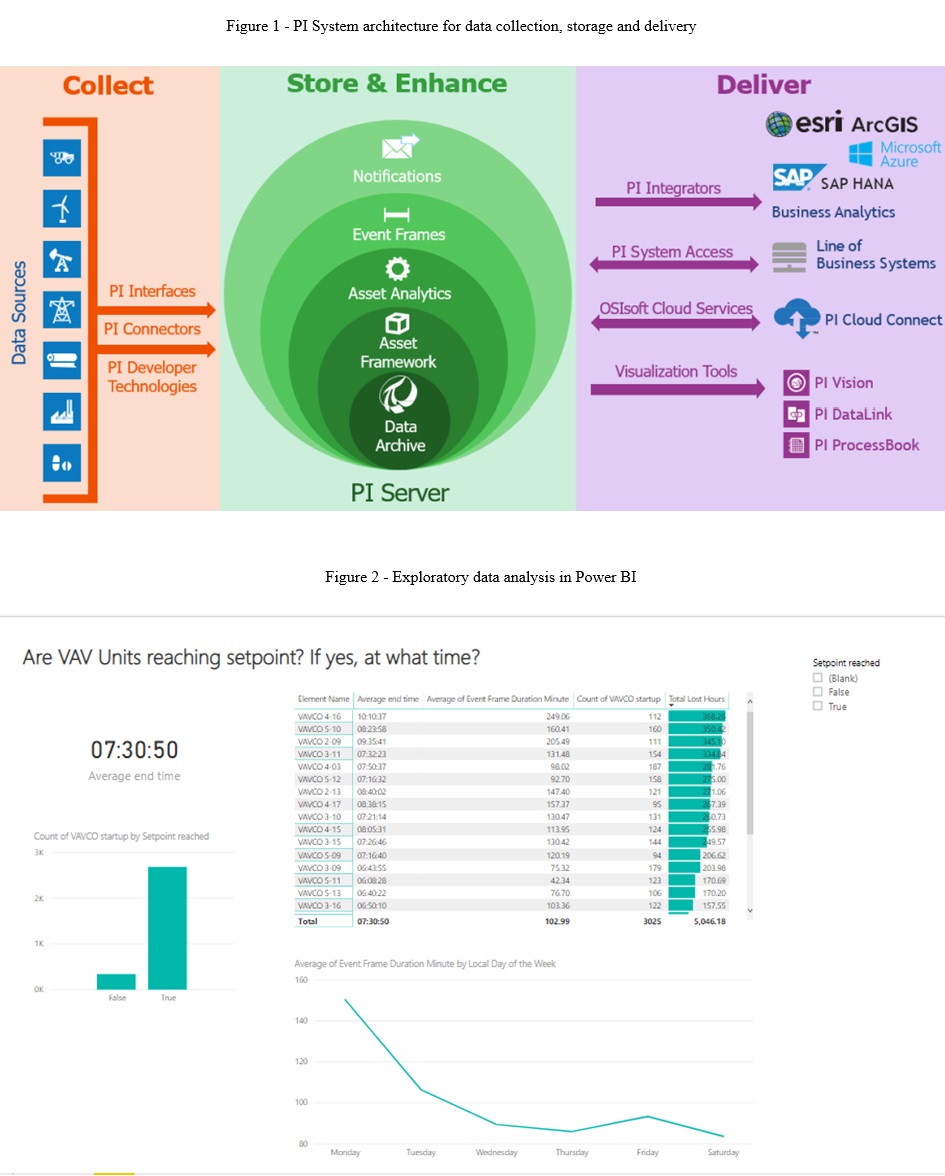
The methodology used integrates a module written and executed in a Python environment and with an OPC communication, ensuring connectivity with the PI System database and visualization applications (Figure 1). This structure allowed the development of supervisory interfaces for monitoring processes and decision-making. For the predictive model, the CRISP-DM methodology, that is widely used in Data Science projects (Piatetsky, 2014), was applied. Such a methodology encompasses six stages: business understanding, data understanding, data preparation, modeling, evaluation, and deployment. In this project, the focus was on the data preparation stage, which involved extracting data from the PI System, exporting it to a CSV file, and ensuring its compatibility with analysis tools. This prepared data was then analyzed in Power BI, utilizing its advanced visualization and analysis capabilities (Figure 2).
Figure 1 - PI System architecture for data collection, storage and delivery
Figure 2 - Exploratory data analysis in Power BI
The results highlight the potential of integrating SPC and the PI System in the simulation of industrial events and in the training of engineers and operators, enhancing process efficiency. Additionally, the digital transformation structure, which includes dynamic simulation software connected to the PI System, serves as a foundation for studies, covering the entire control and optimization structure, and providing a simulated environment close to a real process.
References
Fogler, H., Elements of Chemical Reaction Engineering, Prentice Hall, 1999.
Montgomery, D., Introduction to Statistical Quality Control, JohnWiley and Sons, 2009.
Piatetsky, G. Crisp-dm, still the top methodology for analytics, data mining, or data science projects. KDD News, 2014.
Roffel, B. E Betlem, B., Process Dynamics and Control - Modeling for Control and Prediction, John Wiley & Sons, 2006.