2025 AIChE Annual Meeting
(391k) Using Machine Learning for Wet Gas Flow Metering in an Actual Production Site: Detailed Methodology and Case Study
Authors
Multiphase flow metering is a growing technology that enables individual well monitoring and that has gained acceptance as an alternative to laborious and less representative periodic well tests (periodical evaluation of a well) [1]. In this context, wet gas flow metering (WGFM) devices combine different sensors with advanced data processing techniques to allow the assessment of individual streams in wet gas flows [3], that is, streams with over 95% volume of gas, but that also present liquids [4]. The primary WGFM sensor estimates total flowrate based commonly on pressure drop, but the presence of liquid(s) causes over-reading, which depends on the fraction of liquid(s), composition, and operational conditions such as temperature and pressure. Additional sensors are required to measure liquid flowrates and correct over-reading through advanced data processing [3,4,5].
Research on WGFM has focused on developing phenomenological and empirical modeling for accurate data processing. Machine learning (ML) techniques emerge as valuable tools for identifying complex variable relationships and providing fast model-based monitoring and control solutions. However, most studies combining ML and WGFM rely on well-behaved laboratory data. The present study presents for the first time the detailed evaluation of data preprocessing (to mitigate real-world data measurement errors [6]), feature selection, and data- driven models using data from a real Petrobras’ gas production site in Brazil.
These are key steps for improving WGFM technologies, as virtual sensors can address hard-sensor failures, filter random errors, replace gross-error measurements, and be applied on data reconciliation. Such developments can enhance the technical and economic feasibility of WGFM at plant sites.
A two-year dataset from the operation of a WGFM (model Roxar Subsea Wetgas Meters, manufacturer Emerson) in a Petrobras production well is considered to develop ML approaches for accurate flowrate estimation. The evaluated WGFM provides individual gas, water and condensate flowrates by combining measurements of differential pressure, resonance frequency, amplitude and Q-factor of microwaves interacting with the flow, pressure and temperature [7]. The manufacture’s data processing is a black-box for users.
Both a model based (MBF) and a data driven (DDF) approach are implemented as pre-processing steps before training multi-output neural networks to predict the three flowrates. One network is developed for each approach, which are compared.
The model-based approach considers physics, phenomenology, and operational aspects. First, only data from active well operation is selected using an ON-OFF variable. The first 30 samples after (re)opening are excluded due to transient oscillations, unrepresentative of normal operation. Once relevant data windows are identified, gross error detection is performed by means of filtering. A physics-based filter removes physically impossible values (e.g., negative flowrates or pressure drops). Then, a phenomenological model requires gas flowrate to be proportional to the square root of the pressure drop [8]. The gas stream is the primary focus, and is assumed to reflect potential issues in other flowrates, a hypothesis that proves itself valid.
In the data-driven approach, each flowrate is analyzed separately. First, the most extreme 2% of data is trimmed to reduce outlier influence. A 30-day moving median captures long-term trends, and deviations from this trend undergo another 2% trimming. The minimum and maximum deviations are then used to filter data with a 3-day moving median. Samples where any flowrate is discarded are removed from the final dataset.
The dataset, filtered by either approach, is split into independent (13) and depend variables (3). The independent variables include differential pressure, moving average and instant measures of amplitude, frequency and Q-factor of the microwaves, phase densities, pressure, temperature, and choke valve opening, which dictates the production. The independent variables were the gas, water and condensate flowrates.
Values were normalized. Traditional z-score was applied to independent variables, while a robust z-score was applied to dependent variables, where mean and standard deviation are computed using data within first and third quartiles. This approach mitigates the impact of outliers or faulty data, ensuring all data remains, in fact, within the same order of magnitude
Before model development, a third filter is applied on normalized dependent variables; discarding samples where any value exceeds 20 standard deviations, an inspection-based threshold.
The data is randomly split (80% for training and 20% for testing) for development of neural networks to simultaneously predict the flowrates of gas, water and condensate. Neural networks with one hidden layer then have their hyperparameters optimized by performing cross validation. The number of neurons in the hidden layer (3-30), alpha regularization (0.0001-0.01), and the activation function (ReLU or logistic) are optimized. Final models are evaluated considering the determination coefficient (R2) between observed and predicted values, and relative prediction error.
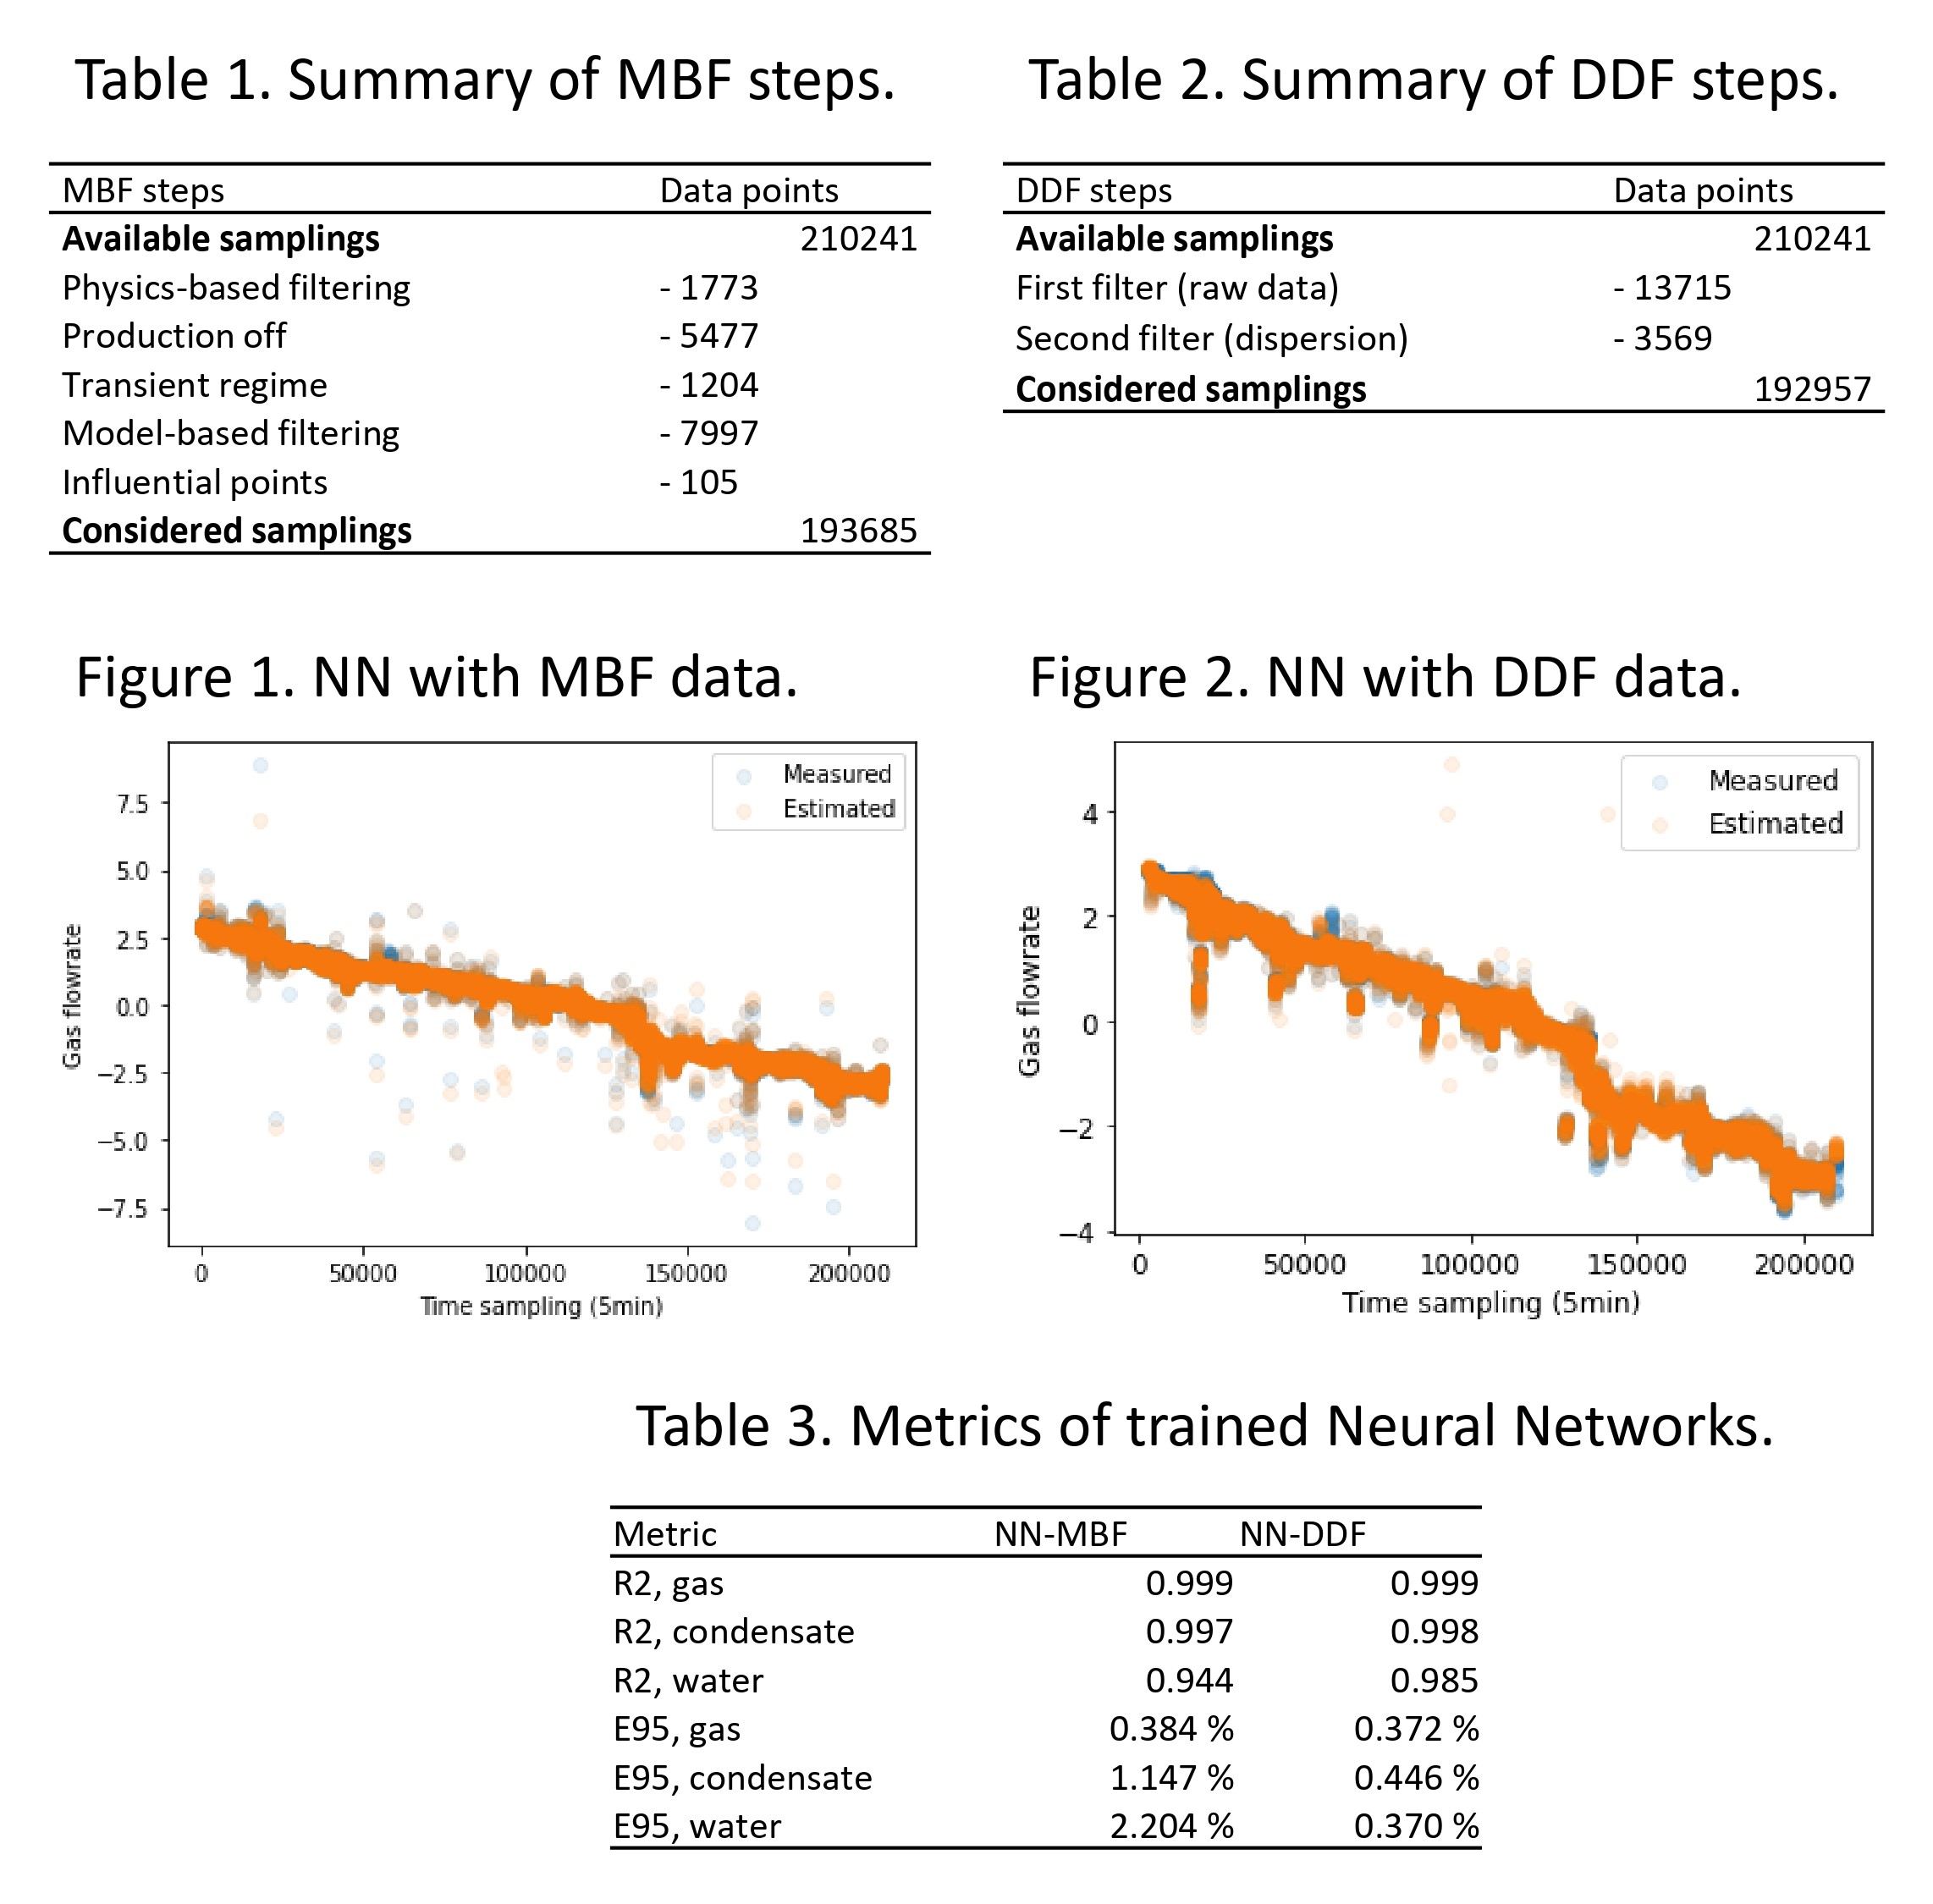
Both data pre-treatments filtered about 8% of data, as detailed in Tables 1 and 2. In particular, it should be highlighted that both approaches effectively filtered samples whose flowrates were up to two orders of magnitude away from the range were most of the flowrates were concentrated.
A comparative analysis of the final datasets when applying the two procedures evidences that MBF allows some data away from the range where gas flowrates are mostly concentrated to be kept on the dataset, while DDF does not. In light of the steps in each filtering, that would mean that, although more distant in terms of flowrate, the relationship between gas flowrate and pressure drop is approximately the same.
A variety of more distinct, while still expected, operational conditions could then be kept in the MBF dataset in comparison to the DDF, which favors the range where most data lie. However, one should note that MBF requires data to follow a model. Although a good fit was obtained for the entire two-year data set (95% of fitting errors below 5% of actual values), it is still a simple model and only takes two variables into account.
Great neural networks were obtained for both final datasets, as shown by the metrics in Table 3. For both developments, the determination coefficient (R2) between measured and estimated values was higher than 0.99 for gas and condensate, while water presented smaller R2, although higher than 0.94. The predicted values were in good agreement with measured values for all flowrates; for the gas stream, in particular, both developments led to 95% of errors (E95) below 0.4% of the measured values. The development with the DDF dataset led to an overall smaller error for predictions. Finally, Figures 1 and 2 present measured and estimated gas flowrates for the test sets in each of the developments; in both cases, a good tracking of the temporal trends were accurately followed.
In summary, in the present study, methodologies to develop neural networks for individual flowrate estimation in wet gas flow metering applications are proposed. In particular, the methodologies are applied with a two-year dataset from an offshore well operated by Petrobras in Brazil. The procedures effectively filter possible faults or measurement error on data prior to development of Machine Learning models by either considering physics and phenomenology of the wet gas metering application or by a purely data driven approach. The trained neural networks were able to accurately estimate, simultaneously, the flowrates of gas, oil condensate and water to with relative errors as low as 0.5%. The provided framework may be replicated to other wells, helping to handle hard sensor malfunctions and providing efficient models to be used in back allocation and data reconciliation schemes.
References
[1] M. Niblett and I. Robertson, “A solution to measure the flow rate of wet gas”, Meas. control., 44/2 (2011) 49–52
[2] T. Bikmukhametov, J. Jäschke, “First principles and machine learning virtual
flow metering: a literature review”. J. Pet. Sci. Eng. 184 (2020) 106487.
[3] M. Meribout, A. Azzi, N. Ghendour, N. Kharoua, L. Khezzar, E. Alhosani, “Multiphase flow meters targeting oil & gas industries”, Meas. 165 (2020) 108111.
[4] S. M. Salehi, L. Lao, L., L. Xing, N. Simms, W. Drahm, “Devices and methods for wet gas flow metering: A comprehensive review”, Flow Meas. Instrum. 4 (2023) 102518.
[5] S. Adenubi, D. Appah, E. Okafor, V. Aimikhe, W. Okologume, “A review of wet gas flow metering correlation”. In: Society of Petroleum Engineers - SPE Nigeria Annual International Conference and Exhibition 2021.
[6] J.A. Romagnoli, M.C. Sánchez, “Data Processing and Reconciliation for Chemical Process Operations”. 1.ed. San Diego: Academic Press, 1999.
[7] A. Hellestø, B. Djoric, G. Farah, S.E. Monge, E. Undheim, L.A. Ruden, “How Shell is Tackling Hydrate/Scale Formation and Optimizing Well Allocation and Production on the Ormen Lange Subsea Field Development”. In: 38th International North Sea Flow Measurement Workshop, 2020.
[8] F.M. White, “Fluid Mechanics”. McGraw-Hill, 2011.