2025 AIChE Annual Meeting
(655f) Toward a Digital Twin of Cardiac Differentiation: Modeling hiPSCs to Early Cardiomyocytes
Authors
The 2D cardiac differentiation data required for this study was collected by Wu Lab at the Stanford Cardiovascular Institute. The standard 2D differentiation protocol mentioned above was used to differentiate the hiPSCs from 4 cell lines. Differentiated cell samples were collected across six days, from days 1 through 6, and subsequently underwent single-cell RNA sequencing. Analysis of the gene expression matrix revealed the cell types present during the early days of the differentiation process. The identified cell types include pluripotent stem cells (psc), early primitive streak (eps), late primitive streak (lps), definitive endoderm, hepatic endoderm, mesodermal progenitors (mp), epicardial progenitors, epicardial cells, endothelial cells, early cardiac progenitors (ecp), late cardiac progenitors (lcp) and early cardiomyocytes [4].
Previously, we introduced a microsimulation model with a Markov chain model to simulate the cell type populations observed during days 1-6 of the 2D cardiac differentiation [6]. The cell types in the differentiation trajectory acted as Markov chain states in this model. Cell types other than the cardiac differentiation trajectory were modeled as absorbing states, such that once a cell transitions to one of these states, it does not return to the cardiac trajectory. The definitive and hepatic endoderm, which arise along with the mesodermal progenitors from the late primitive streak, were grouped into absorbing state 1. Similarly, epicardial progenitors, epicardial cells, and endothelial cells branching from the mesodermal progenitors were assigned to the absorbing state 2. The transition probability between two states determines the cell's fate in the digital differentiation process. The exponential distribution controls the time the cells take to differentiate between two states. The microsimulation model was run 5000 times to obtain the average cell type population across days 1-6. Although the model captured the temporal progression of cell types in the datasets, it exhibited a higher validation mean squared error (0.17). This arises because of the high standard deviation between the datasets (0.21), which might reflect the difference in differentiation speed between different cell lines. Therefore, reducing or removing the cell line effect is essential to modeling the hiPSCs-CMs developmental trajectory accurately.
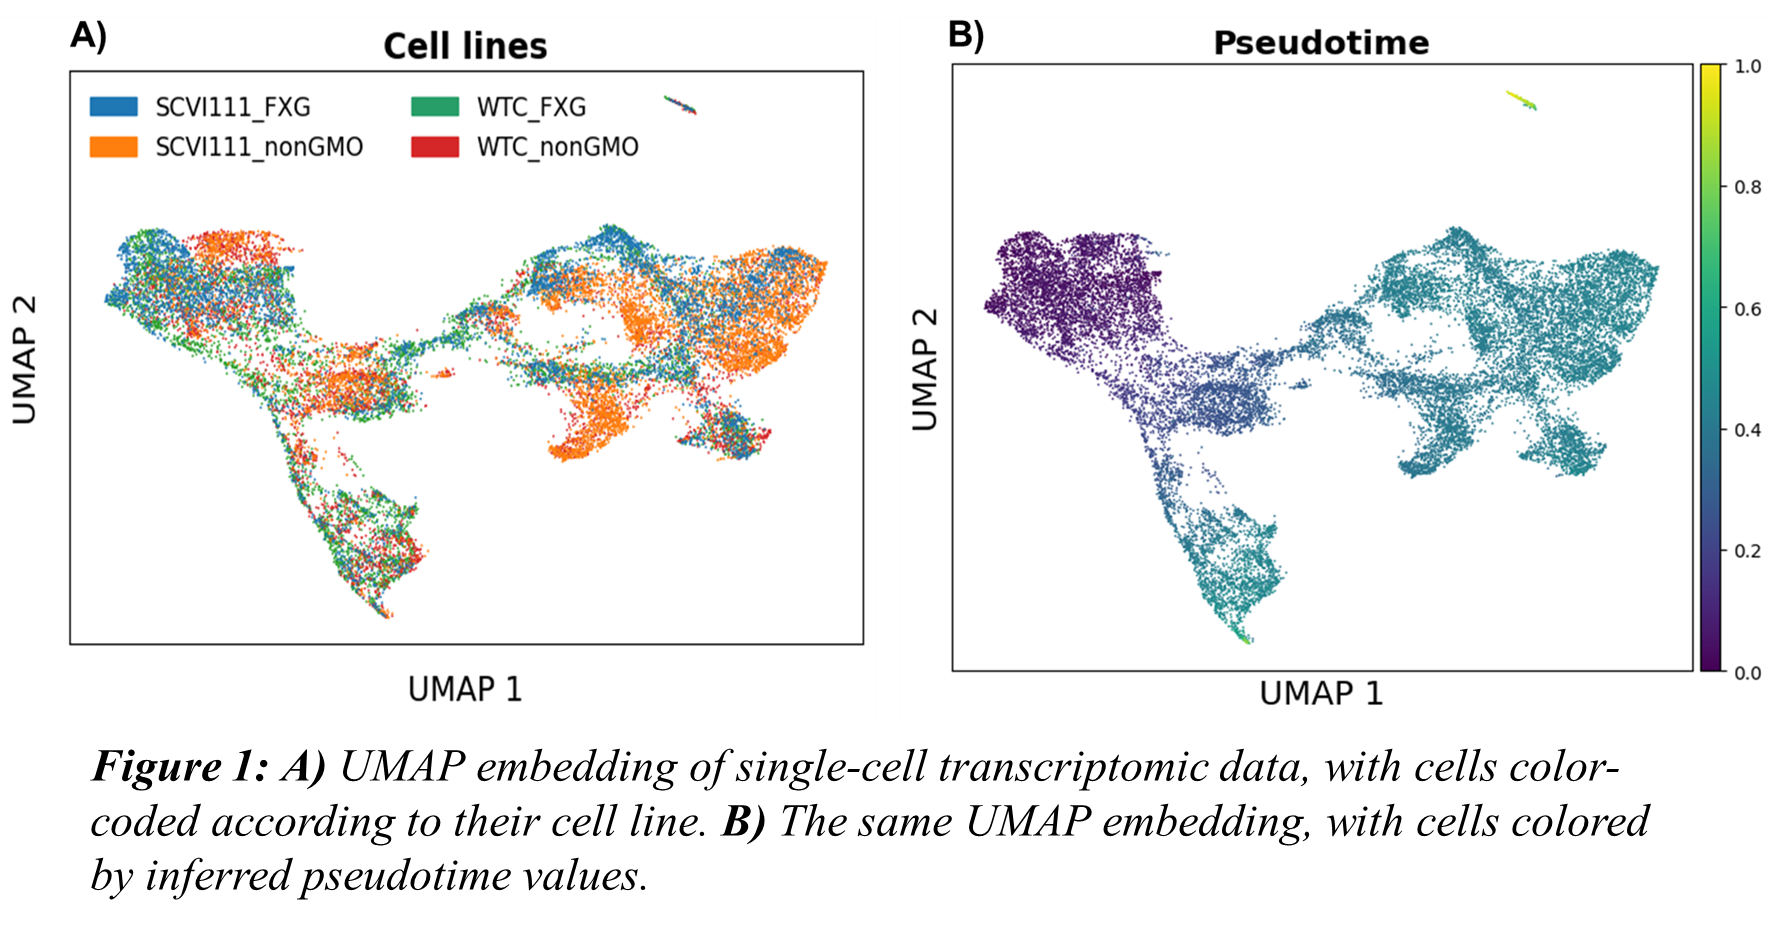
This study considers the pseudo-time-based approach to address the variability introduced by cell line–specific differentiation speeds. Pseudo-time for the cells was calculated from the batch-corrected principal components of the single-cell gene expression matrix [7]. In the pseudo-time space, cells of the type are placed closely together, while different cell types are placed further apart, forming a continuum. The different cell types are placed in a sequence that follows the cell stages present in the differentiation trajectory. This approach effectively placed cells according to their developmental stage, independent of the cell lines. The resulting pseudo-time-aligned dataset for 19989 cells captured during the single-cell sequencing was used to estimate the parameters of the microsimulation model. Figure 1A presents a UMAP projection of the cells, color-coded by cell line identity. Figure 1B demonstrates that neighboring cells in the UMAP space exhibit similar pseudo-time values, mitigating the effects of the cell lines.
To evaluate the microsimulation model, we propose a new loss function to compare predicted and experimental cell-type populations. The pseudo-time range (0-1) was divided into discrete bins, and the bins where each cell type was most expressed were identified. Within each bin, we calculated the fraction of cells belonging to each cell type. The microsimulation model predicts the end cell type for a given cell and its age, and the simulation was run 7000 times. The resulting ages of the cells were then normalized to match the pseudo-time range, and the cell type populations were calculated within the same pseudo-time bins used for the experimental data. The loss was calculated as the mean-squared error between the cell-type populations and the predicted cell. Bayesian Optimization was employed to estimate the model parameters.
The overall mean squared error between experimental and predicted cell type populations was 0.02, which is lower than the previously published result of 0.17 [6]. At a cell type-based higher resolution, the mean squared error between experimental and predicted cell type populations for the bins corresponding to pluripotent stem cells, early primitive streak, late primitive streak, absorbing state 1, absorbing state 2, late cardiac progenitors, and early cardiomyocytes are less than 0.01, indicating the model’s ability to capture the pattern in the data. In contrast, the mean squared error for the bins corresponding to mesodermal progenitors and early cardiac progenitors are 0.11 and 0.023, respectively. This discrepancy may be attributed to the positioning of cells in the pseudo-time space. As shown in Figure 1A, while similar cell types from different cell lines are generally clustered together, certain populations, particularly those from the SCVI111_non_GMO and SCVI111 cell lines, remain partially segregated and do not integrate well with the other two cell lines.
The model accurately captured the cell type populations for the bins from pluripotent stem cells to late primitive streak. However, its predictive performance declined in the bin corresponding to absorbing state 1 and subsequent stages, where it failed to match experimental cell type proportions. Since the numerical values corresponding to the cell populations at the later stage of differentiation are relatively small, the mean squared error does not reflect the true discrepancies in model performance. This implies the use of evaluation metrics that are sensitive to errors in populations with low numerical values.
In this analysis, a pseudo-time-based method was utilized to transform the experimental time point of the collected cell samples to a principal components-based time domain to reduce the effect of the cell lines. The microsimulation model with the estimated parameters captured the cell-type populations in the initial stages of differentiation but failed to capture cell-type populations in the later stages. Future work involves modifying the loss functions by incorporating non-linear measures such as the exponential penalties to accurately capture discrepancies between the experimental and the predicted cell type populations. converting predicted pseudo-time values to the real-time domain to make practical decisions. A regression model can be employed to find the relationship between pseudo-time and experimental time to convert the pseudo-time back to the real experimental time domain. The overall framework will be implemented in 3D cardiac differentiation systems as well to predict the cell type populations present in the 3D systems. This presentation will detail the development of the microsimulation model, assess the impact of cell line-specific effects on its performance, describe the implementation of a pseudo-time-based alignment strategy to mitigate these effects and present the model’s predictive outcomes.
References:
- Ahmed, R.E., et al., A Brief Review of Current Maturation Methods for Human Induced Pluripotent Stem Cells-Derived Cardiomyocytes. Front Cell Dev Biol, 2020. 8: p. 178.
- Li, J., et al., hiPSC-derived cardiac tissue for disease modeling and drug discovery. International journal of molecular sciences, 2020. 21(23): p. 8893.
- Tani, H., et al., Production of functional cardiomyocytes and cardiac tissue from human induced pluripotent stem cells for regenerative therapy. J Mol Cell Cardiol, 2022. 164: p. 83-91.
- Galdos, F.X., et al., Combined lineage tracing and scRNA-seq reveals unexpected first heart field predominance of human iPSC differentiation. Elife, 2023. 12: p. e80075.
- Basso, C., et al., Arrhythmogenic right ventricular cardiomyopathy. The Lancet, 2009. 373(9671): p. 1289-1300.
- Rajendirana, S., et al., Modeling hiPSC-to-Early Cardiomyocyte Differentiation Process using Microsimulation and Markov Chain Models. 2024.
- Haghverdi, L., et al., Diffusion pseudotime robustly reconstructs lineage branching. Nature methods, 2016. 13(10): p. 845-848.