2025 AIChE Annual Meeting
(102d) System Analysis and Optimization of U.S. PET and Polyolefin Packaging Supply Chains in a Circular Economy
Authors
Our systems analysis model includes U.S. material flows from virgin resin production through semi-manufacturing processes to EOL disposal and recycling processes, including emerging advanced recycling technologies for which data is available such as pyrolysis of polyolefin wastes and hydrolysis/solvolysis of waste PET. The basis for the system optimization is the annual plastics packaging material streams that enter EOL management based on national US EPA waste generation statistics and county population density data. From a set of existing and proposed future facility locations for material recovery facilities (MRFs) and plastics recycling facilities (PRFs; mechanical and chemical recycling), optimum transportation logistics distances, facility locations and capacities were determined.
The optimization model predicts that to achieve minimum GHG emissions 78% of U.S. PET and polyolefin packaging should be collected for sorting and recycling and 22% should be sent to landfills across the U.S, with zero percent incineration assuming a 100 km maximum collection distance. However, the percents collected versus landfilled varies greatly by state and by maximum collection distance. Furthermore, the results show that compared to a linear economy for U.S. plastics packaging, an optimized circular plastics packaging system is expected to achieve greenhouse gas emissions savings of up to 28% and cumulative energy demand savings of up to 46%, a result achieved when waste plastics packaging collection distance increases to 500 km. The optimal systems-level circularity ranged from 57% to 75%. Overall, transitioning to an environmentally optimum closed-loop recycling supply chain for plastics packaging requires both mechanical and emerging advanced recycling technologies to achieve the best results.
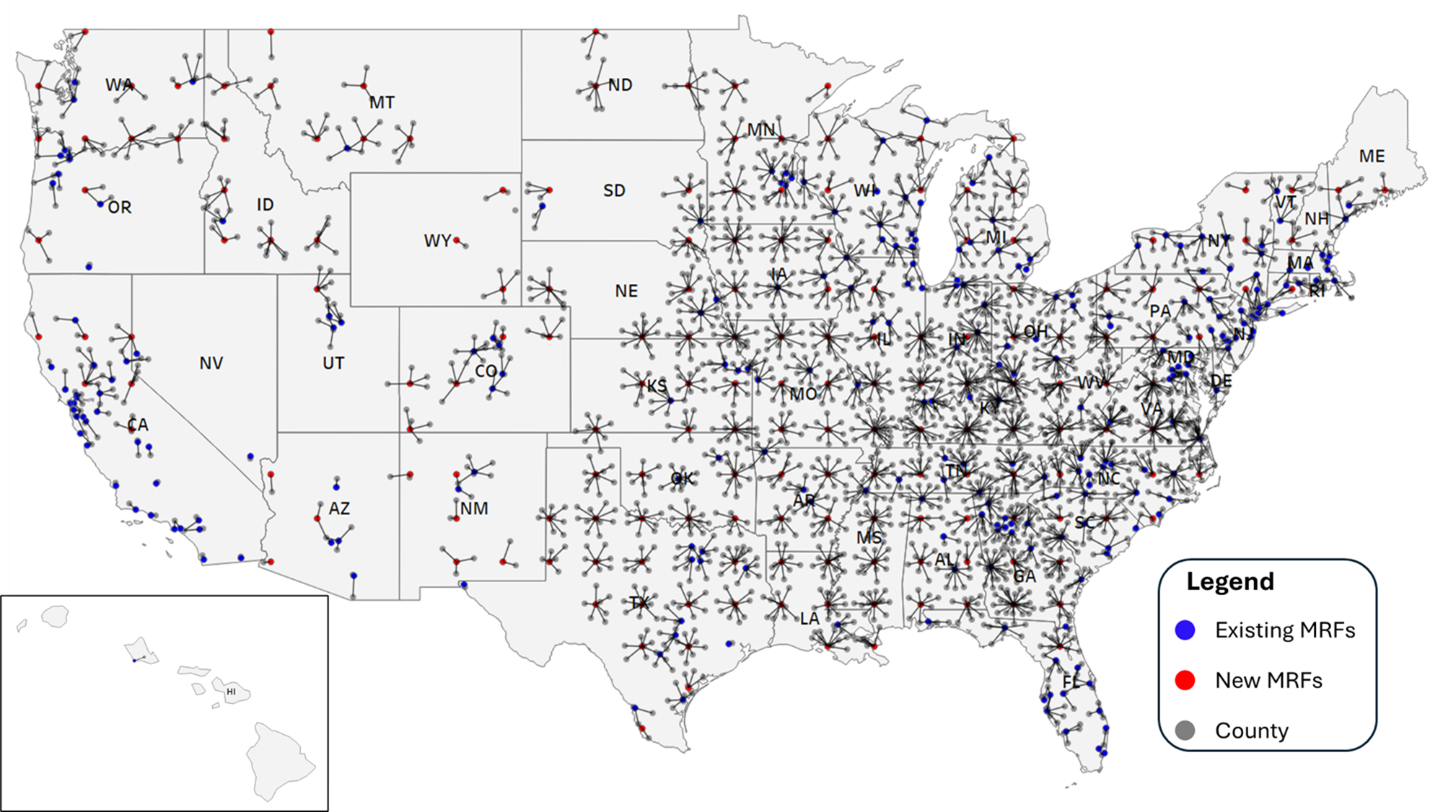
Figure Caption. County-to-MRFs (C-2-M) optimal U.S. EOL PET and PO packaging recycling material flow network for system optimized on GHG emissions with 100-km MRF collection proximity. Notes: 1) Only the counties participating in recycling within the 100-km collection distance are shown in this figure; 2) Alaska has a 0% recycling rate, therefore, is not shown in this figure. 3) This figure shows material flows from counties (origin) to MRFs (destination).