2025 AIChE Annual Meeting
(624d) Size-Controlled Templating of Lipophilic Drug Nanoparticles from Nanoemulsion Precursors for Versatile Nanoformulation
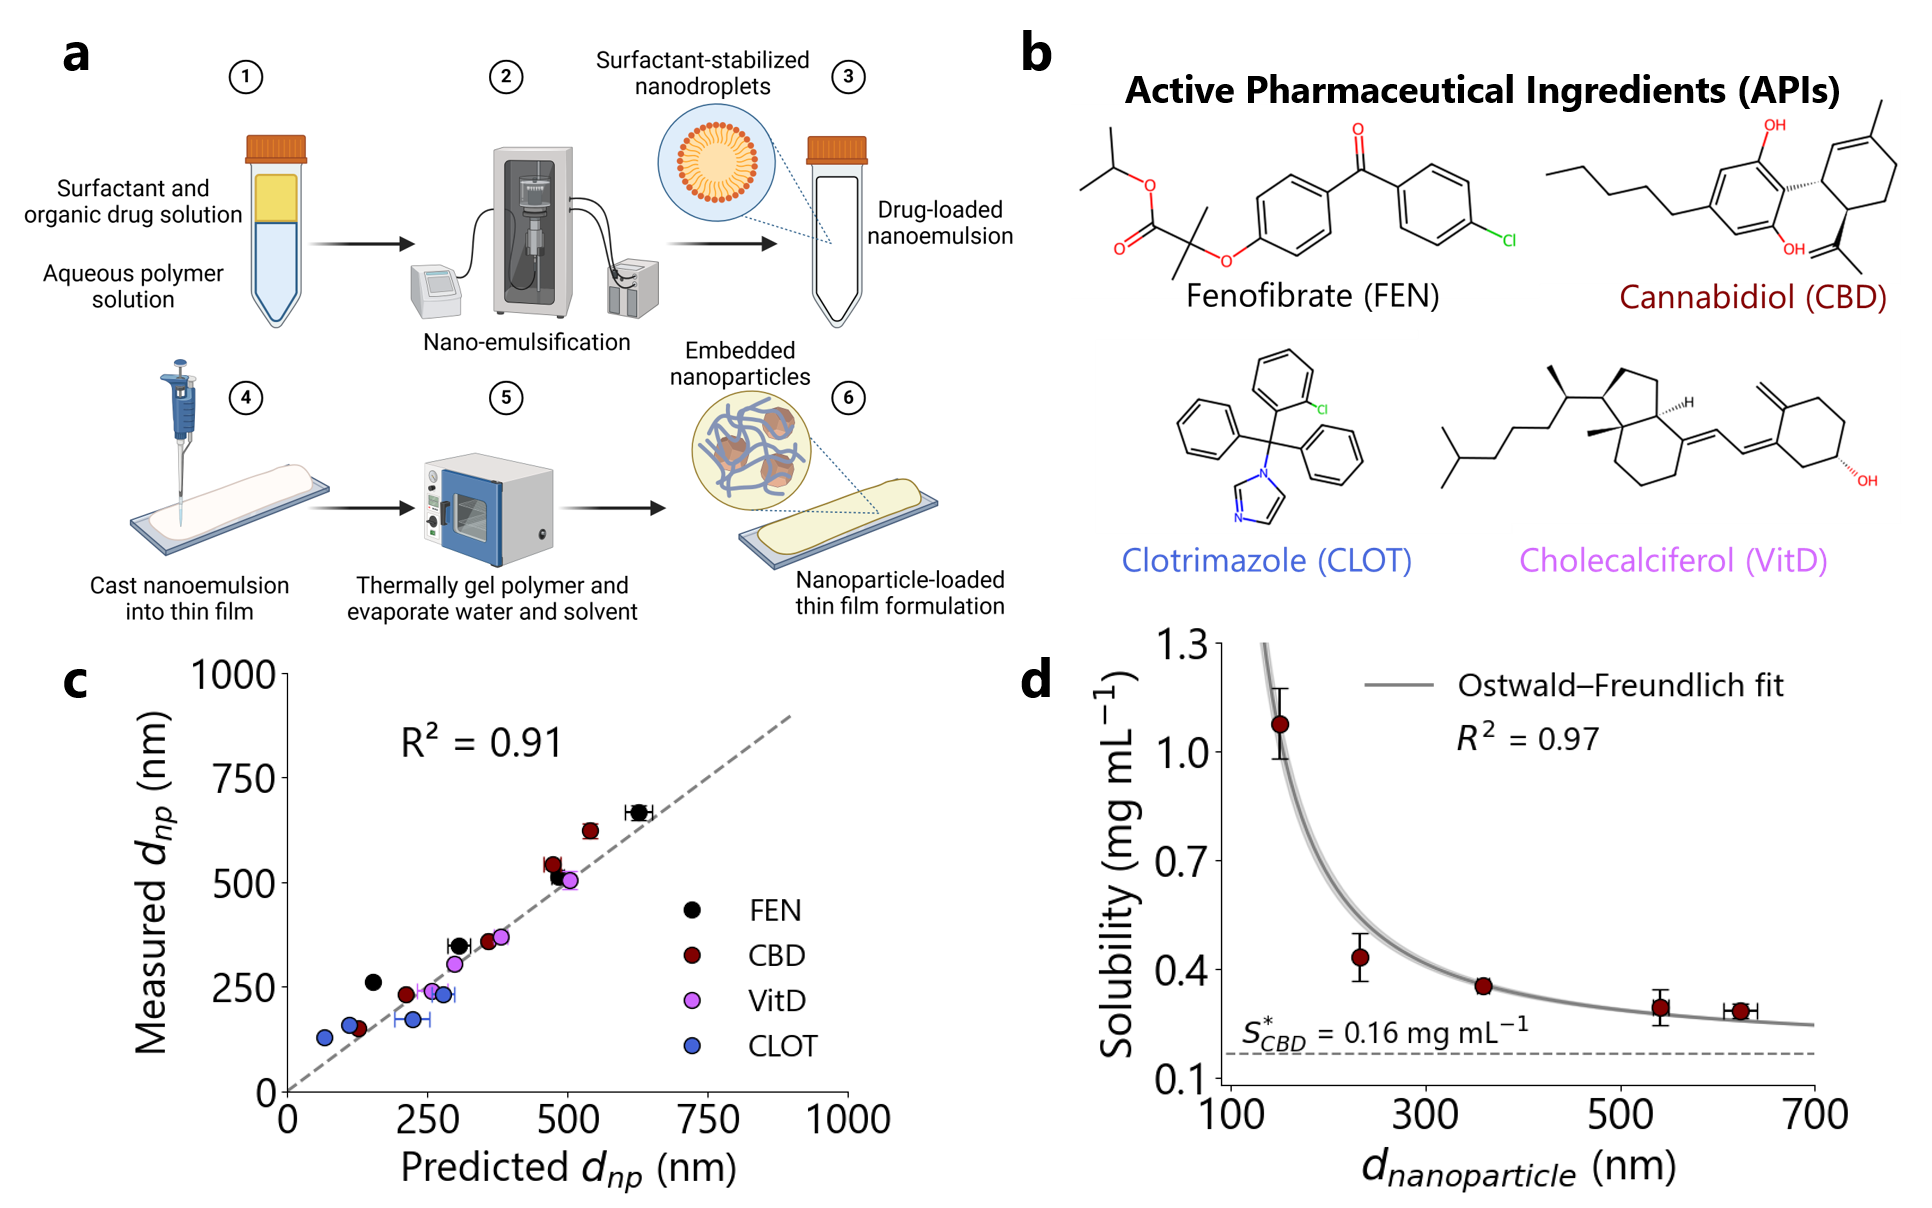
In this study, we present a generalized bottom-up method by encapsulating drug-loaded nanoemulsions within a hydrogel thin film, followed by solvent evaporation to template solid drug nanoparticles throughout the resulting polymer matrix (Figure 1a). We prepare nanoformulations of four structurally distinct lipophilic APIs: fenofibrate, cannabidiol, cholecalciferol (vitamin D3), and clotrimazole (Figure 1b). Through controlling the precursor nanodroplet size, we demonstrate precise control over nanoparticle diameter between 100-1000 nm (Figure 1c). Importantly, we show that the particle size distributions are shelf-stable for at least 6 months within the polymer film. This approach can be easily tuned to yield high drug loadings (<70 wt. %). The nanoformulations also exhibit significantly faster in vitro drug release over the traditional microcrystalline formulations of these APIs. Finally, the apparent thermodynamic solubility of cannabidiol is shown to increase with decreasing nanoparticle size, following the Ostwald-Freundlich equation5 (Figure 1d). Overall, this approach offers facile nanoparticle size control, long-term product stability, and improved in vitro bioavailability, providing a generalizable and versatile platform for enhancing the oral bioavailability of lipophilic drug candidates.
References
- Waring, M. J., Arrowsmith, J., Leach, A. R., Leeson, P. D., Mandrell, S., Owen, R. M., ... & Weir, A. (2015). An analysis of the attrition of drug candidates from four major pharmaceutical companies. Nature reviews Drug discovery, 14(7), 475-486.
- Rabinow, B. E. (2004). Nanosuspensions in drug delivery. Nature reviews Drug discovery, 3(9), 785-796.
- Chan, H. K., & Kwok, P. C. L. (2011). Production methods for nanodrug particles using the bottom-up approach. Advanced drug delivery reviews, 63(6), 406-416.
- Kawabata, Y., Wada, K., Nakatani, M., Yamada, S., & Onoue, S. (2011). Formulation design for poorly water-soluble drugs based on biopharmaceutics classification system: basic approaches and practical applications. International journal of pharmaceutics, 420(1), 1-10.
- Wu, W., & Nancollas, G. H. (1998). A new understanding of the relationship between solubility and particle size. Journal of solution chemistry, 27, 521-531.
Figure 1: Nanosizing structurally diverse lipophilic active ingredients using nanoemulsion templating. (a) Overview of nanoemulsion templating process inside hydrogel thin films. Active ingredient is dissolved in an organic solvent. This solution is nano-emulsified in a polymer solution using ultrasonication and (optionally) surfactant. The nanoemulsion is cast into a thin film, and dried to template size-controlled drug nanoparticles embedded and stabilized in a polymer matrix. (b) APIs used in this study, with abbreviations shown in parentheses. (c) Parity plot of measured mean drug nanoparticle diameter (dnp) against theoretical (dnp) predicted. Points represent average of 5 dynamic light scattering measurements, while error bars show standard deviation in the measured and predicted diameter, R2 = 0.91. (d) Measured apparent thermodynamic solubility (mg mL-1) of CBD as a function of dnp. Points represent average of 5 points, while error bars represent standard deviation in measured dnp and solubility. Curve represents fit to the Ostwald-Freundlich Equation, with shaded area representing the model uncertainty, R2 = 0.97.