2025 AIChE Annual Meeting
(450c) Sector Allocations, Supply Versus Demand and Policy Considerations for Rare Earth Elements
Authors
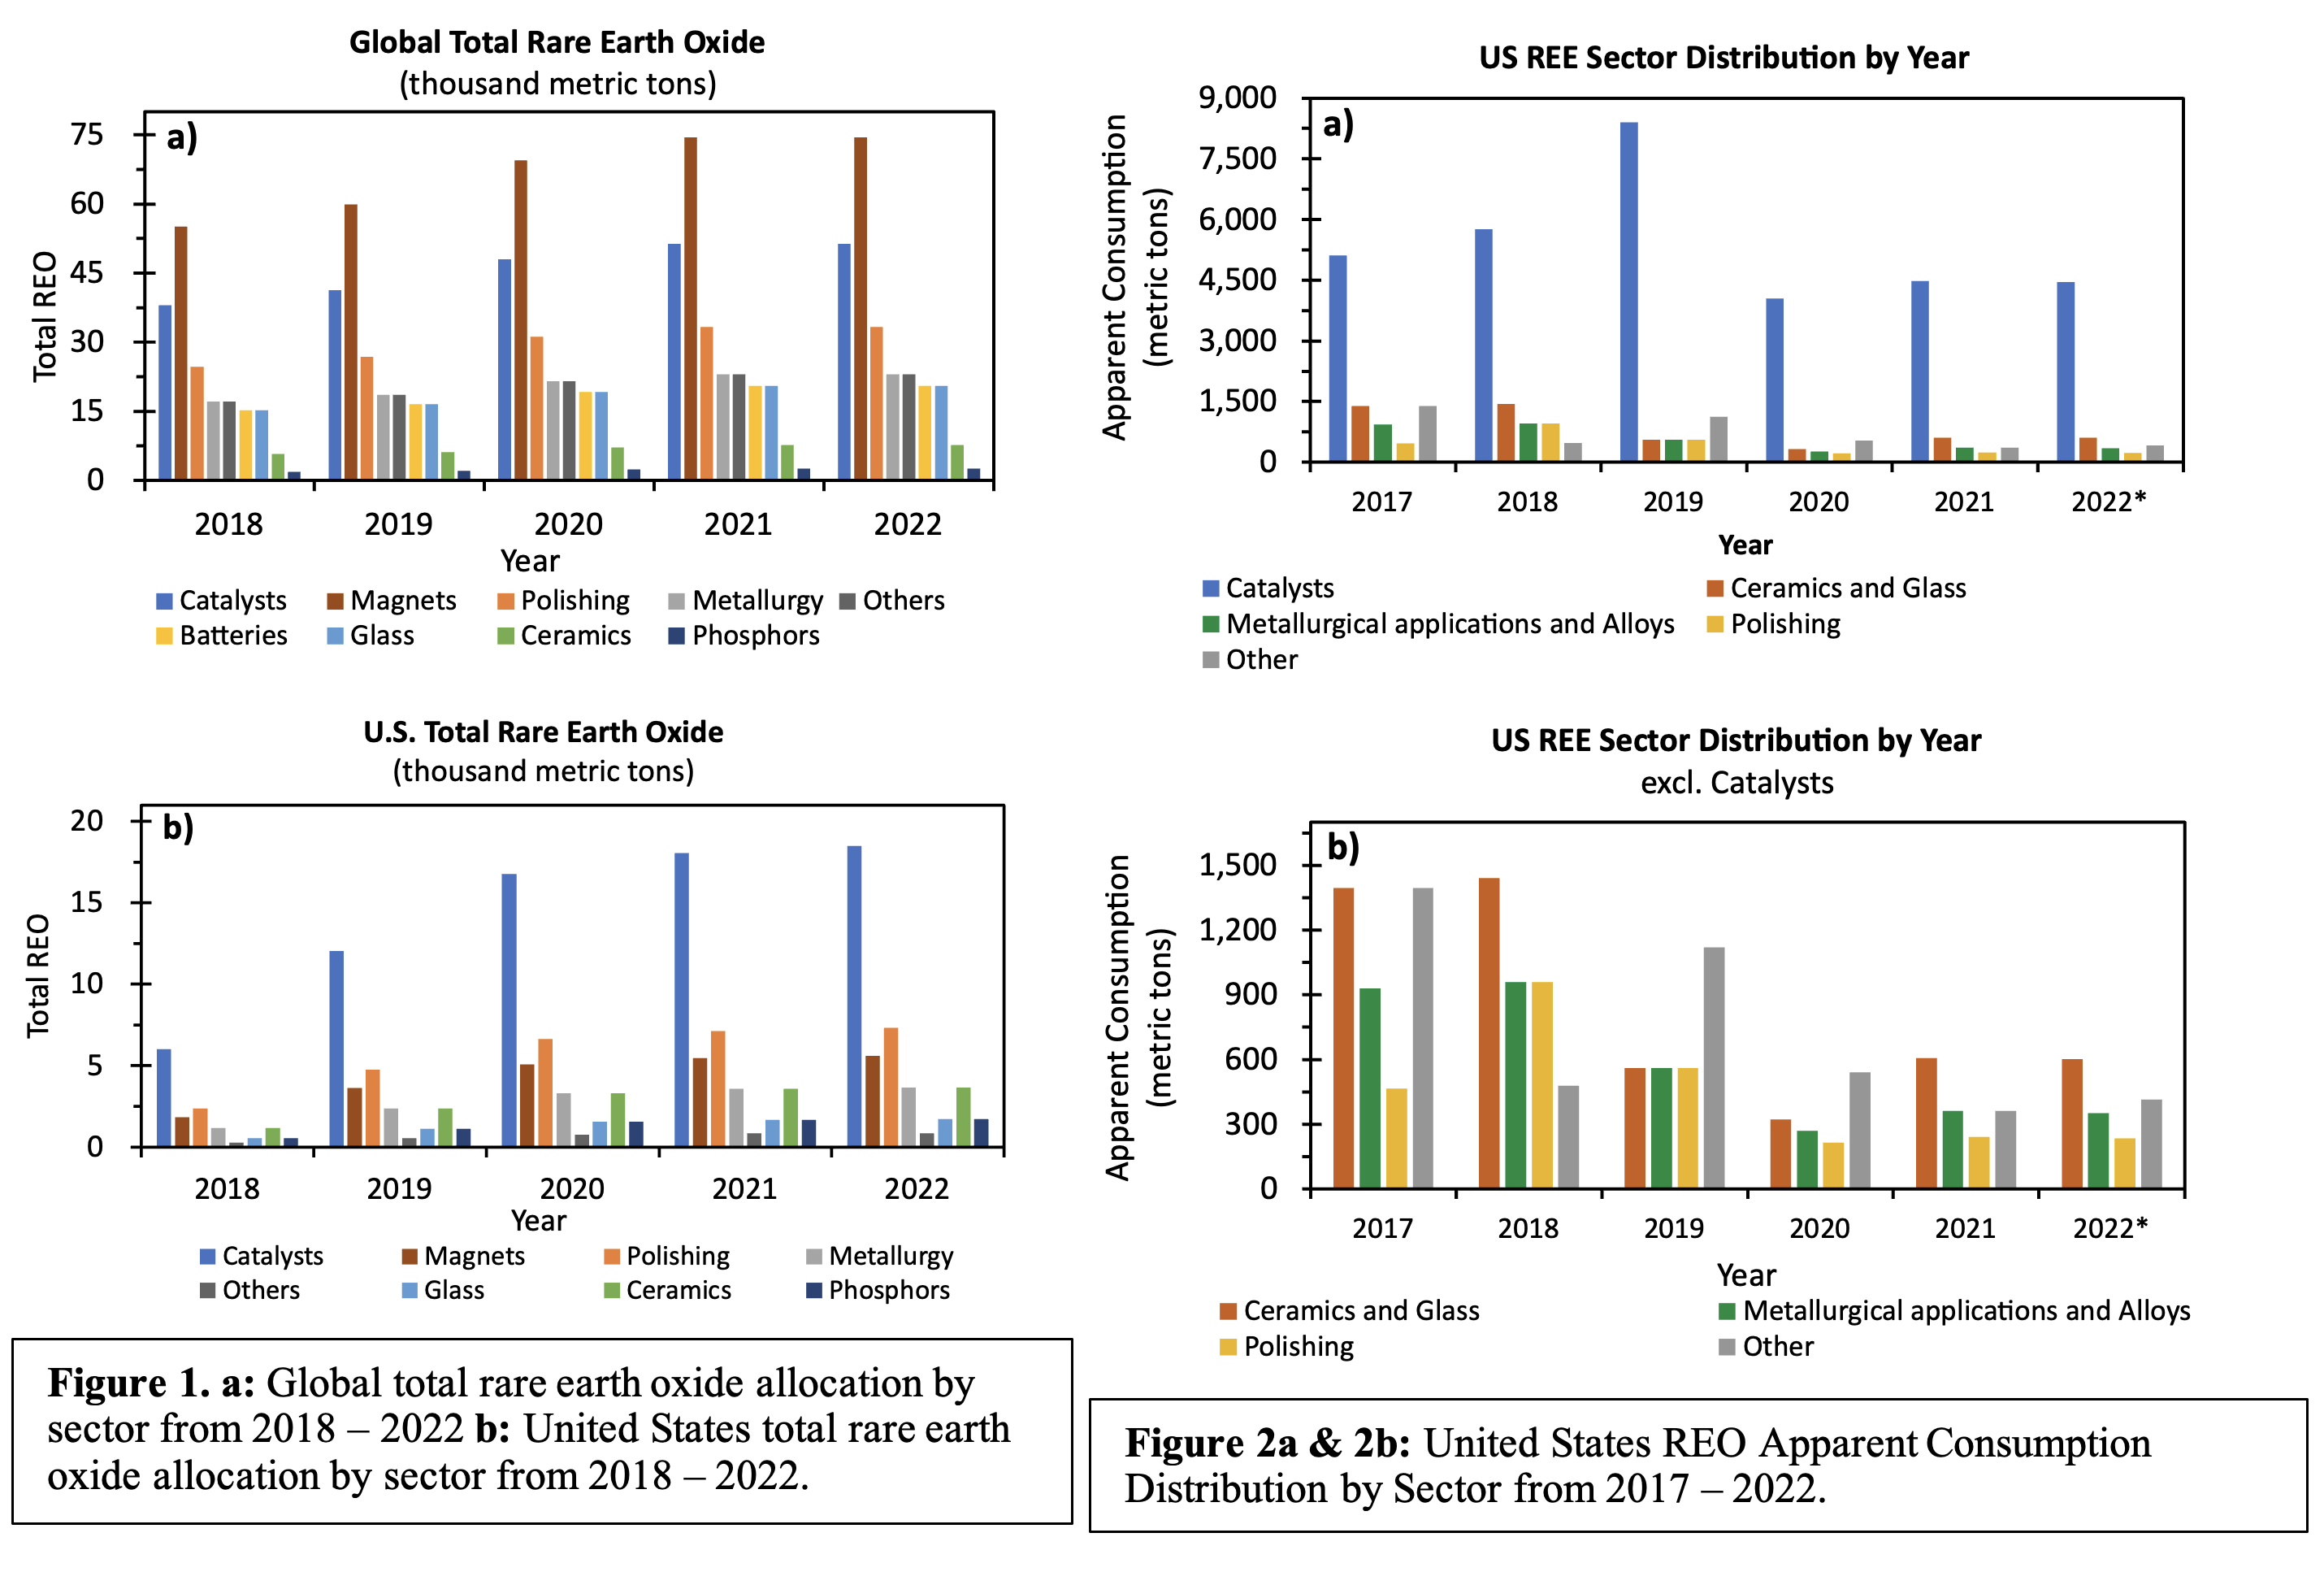
Global allocations derived by proportioning global REO production across sectors using Global Wind Energy Council (GWEC) allocations are summarized in Fig. 1a [4]. Given that the percentage allocations of REEs across end use sectors varies incrementally, these percentages were applied to the global TREO produced for the period 2018-2022. While the relative percentages within a given year are constant, the progressive increase reflects the expanding production following demand. In order, magnets, catalysts, and polishing are the three largest categories of REE use. Similarly, US REO annual production (restarted in 2018) was apportioned across sectors using the fractional allocations originally presented by Humphries [5]. These results are presented in Fig. 1b. The values in Fig. 1b provide a baseline for sector use were only U.S. produced REO used to fulfill sector demands on a national level. Implicit in this is the resource mineral allocations. For MP, the ore is bastnasite, rich in light REEs and sparse in heavy REEs.
The global allocations are constant in the sense that they represent the sum total of sector consumption, capturing total supply and demand. However, on a national level sector allocations for actual consumption will differ from global percentages due to economic level, manufacturing capabilities and international trade. Therein a more realistic estimation for these values was calculated using the U.S. apparent (net) REO consumption (imports-exports) values and percentage sector allocations reported by the USGS [6]. Results are presented in Figs. 2a and in Fig. 2b with the catalyst category removed for better resolution of the domestic allocations. Among the sectors, catalysts based on rare earths has grown and dominates all other domestic market sectors. Fractionally, in the U.S., catalysts are more than 2-fold greater than the global fraction. By comparison, the U.S. has no market sector associated with batteries or magnets – nor related manufacturing to register. In contrast, the battery and magnet sectors are approximately 30% and 75% of the corresponding global REE market. As shown in Fig. 2b, the smallest market sectors in 2021 are polishing or the “Other” category, representing REEs in chemicals, satellite systems and military weapons and delivery systems. Polishing and “Other” sector uses represented 4% and 6% respectively, in 2021. No percentage sector allocations were reported by the USGS in the 2023 mineral commodity summaries report. The presented 2022 sector allocation values were calculated using the historical trend averages from the years 2019-2021 using a sector specific CAGR as calculated from those years.
The annual net apparent consumption resolved by sector provides the basis by which to estimate economic value associated with the rare earth compounds as the starting point for the manufacturing value chain. The USGS reports annual REO distributions of rare earths by end use and aggregated economic value. Fig. 5 summarizes the annual economic value for rare earth oxides and metals with co-comparison to the net consumption. Economic estimates were calculated by scaling data compiled by the American Chemistry Council in 2014 using the U.S. REO net use [7]. Over the period from 2017-2020, the U.S. net consumption for intermediate and end products has remained roughly steady with the exception of 2020-2022, reflecting an increasing reliance upon import of semi- or finished products. Correspondingly the related domestic manufacturing has experienced a substantial downturn with the loss of the upstream supply chain. Meanwhile the aggregated economic value correlates with apparent REO import.
This talk further reviews the origin for the high critical mineral demand and response of the auto industry. Those critical minerals key for electrification and battery electric vehicles in particular include lithium, copper, nickel, graphite, cobalt and neodymium. Against this demand are the supply limitations, along with questionable scalability going forward despite enthusiastic projections. The growing crisis is put into context by considering full accounting of CO2 generation and energy generation in total.
Funding: This research was partially supported by the United States Department of Energy, National Technology Laboratory through the NETL-Penn State University Coalition for Fossil Energy Research (UCFER 0007-PSU-DOE-6825, DE-FE0026825).
References
- Nkiawete, M. and Vander Wal, R. Sector Allocations and Supply Chain Considerations for Rare Earth Elements, of Rare Earths (2024).
- MRS Energy & Sustainability: A Review Journal. pp. 1-16. Materials Research Society, (2018) doi:10.1557/mre.2018.7 Introduction from Rare Earths, a Review of the Rajive Ganguli and Douglas R. Cook, Mineral Industry Research Laboratory, University of Alaska Fairbanks, Fairbanks, Alaska 99775, USA.
- Rare-Earth Metals Market Published Date: March (2021) | Report Code: MM 7863 https://marketsandmarkets.com/Market- Reports/rare-earth-metals-market-121495310.html
- Rare Earths: Outlook to 2030; Technical Report; Roskill: London, UK, (2021).
- Humphries, (2013). Rare Earth Elements: The Global Supply Chain. Congressional Research Services. 7-5700. 41347.
- S. Geological Survey. (2022). Mineral commodity summaries 2022: U.S. Geological Survey, 202 p., https://doi.org/10.3133/ mcs2022.
- The economic Benefits of the North American Rare Earth Industry, Rare Earth Technology Alliance Report, American Chemistry Council, April 2014.