2025 AIChE Annual Meeting
(46g) Elucidating the Use of Pressure-Recovery Diagrams for Analyzing Energy Consumption in Reverse Osmosis Desalination
Authors
For seawater RO (SWRO), where the pressure drop relative to feed osmotic pressure is small and operation is near the thermodynamic limit, staged designs with interstage booster pumps or batch RO can enhance flux uniformity, thereby reducing SEC. In closed-circuit RO (CCRO), the internal staging feature improves flux uniformity, helping to lower energy consumption. However, the undesirable mixing of retentate and fresh feed streams in CCRO increases energy consumption. The combined effect of these factors results in comparable energy performance between CCRO and single-stage RO under typical SWRO design conditions.
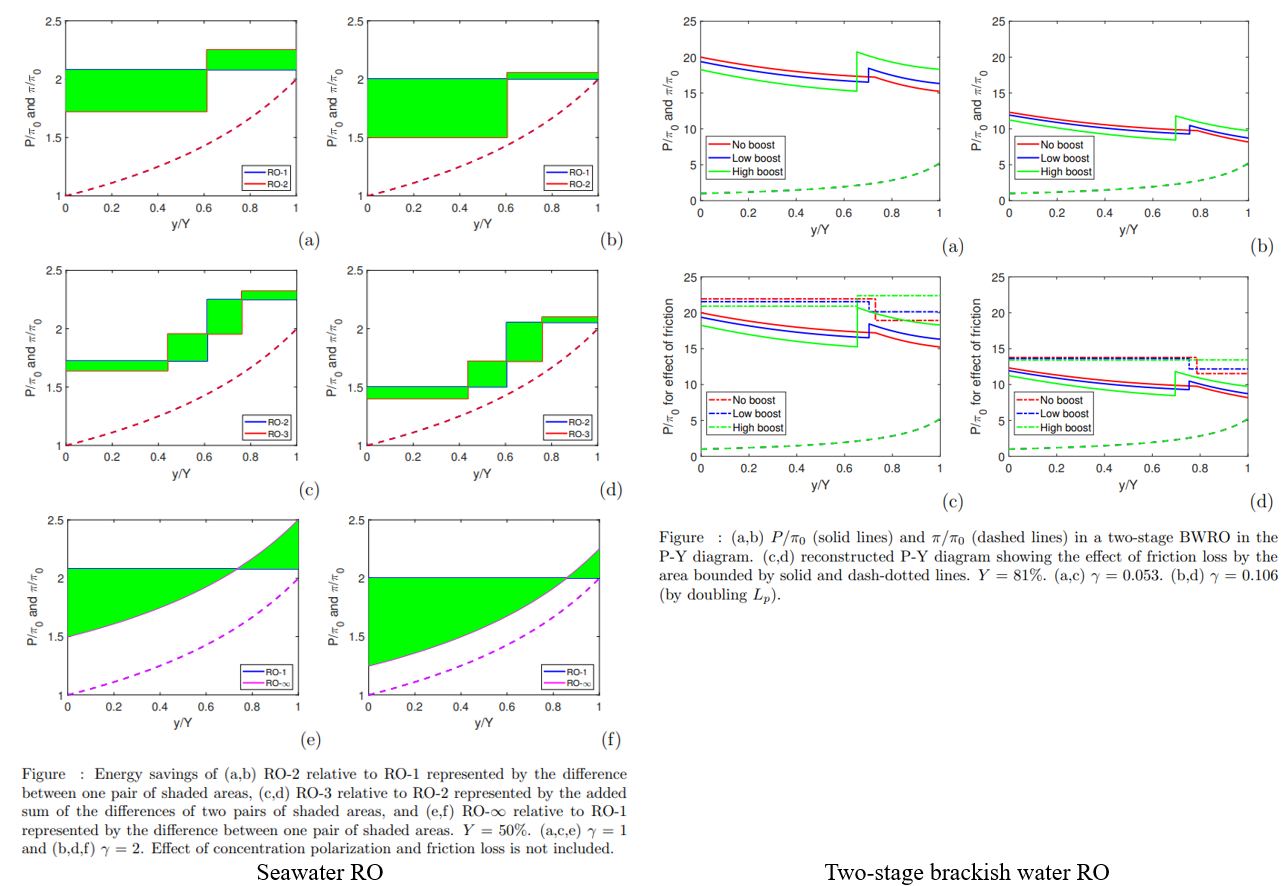
For low-salinity brackish water RO (BWRO), improving flux uniformity using interstage booster pumps may actually increase SEC, as the additional friction losses often outweigh the reduction in energy demand due to system flux. The primary benefits of interstage booster pumps lie in improved permeate quality, reduced fouling in the first stage, extended membrane life, and enhanced control over permeate flow in individual stages, rather than in energy savings.
The use of ultrapermeable membranes may reduce the minimum SEC imposed by the design flux (J̅w/Lp, where J̅w is design flux and Lp is membrane permeability coefficient). However, it also increases spatial flux variation, leading to a higher penalization coefficient when calculating the actual SEC required by the design flux. Additionally, imperfect membranes result in greater salt transport when using ultrapermeable membranes. Both effects can be mitigated by adding interstage booster pumps or optimizing booster pump pressures. Based on the cases studied in this work, doubling membrane permeability in SWRO and transitioning from a single-stage to a two-stage system with an interstage booster pump could reduce SEC by 17%. For low-salinity BWRO, doubling membrane permeability may lead to an SEC reduction of approximately 40%.
Reference:
[1] Li, M. and Lin, S., 2024. Elucidating the use of pressure-recovery diagrams for analyzing energy consumption in reverse osmosis desalination. Desalination, 591, p.118033.