2025 AIChE Annual Meeting
(511f) Efficient Methods for Solving Large-Scale Biofuels Network Design Models
While detailed network design models have been developed, often in the form of mixed-integer linear programming (MILP) models, to study large-scale biofuels networks, they have typically relied on coarse spatial data (e.g. county-level biomass availability). This is largely because of the difficulty in acquiring high-resolution data. Recently, researchers have made major advances in identifying and characterizing highly granular fields for ligno-cellulosic crop production, creating new opportunities to integrate high-resolution, spatially explicit data into network design models. Nevertheless, incorporating such detailed data significantly increases the complexity of these models, leading to a substantial rise in the number of variables and constraints. In particular, medium-term tactical decisions—such as biomass procurement and transportation routing—become increasingly computationally demanding as data resolution improves [3].
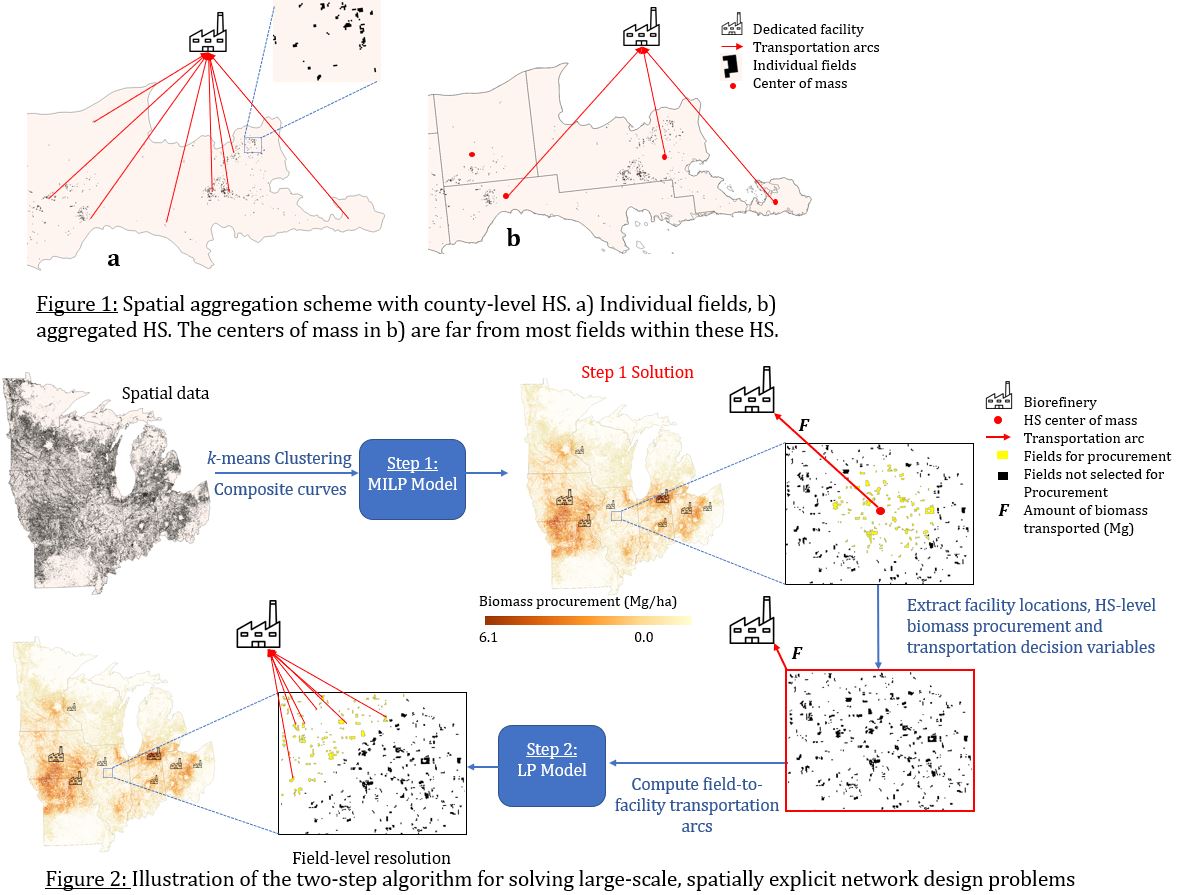
To address this problem, researchers have developed spatial aggregation methods to group small, individual fields into larger representative “harvesting site” (HS). This approach allows biomass procurement and transportation variables to be employed at a coarser resolution, reducing the computational complexity of the models [4][5]. However, aggregation can reduce data accuracy. The properties of HS are typically calculated as averages of field properties within them, overlooking the variability of properties within these fields. Additionally, HS commonly has fixed resolutions (e.g. counties or 30km x 30km), and the transportation arcs from these HS are assumed to originate from the center of mass of these HS, determine based on the locations of fields and their biomass availabilities [5][6]. Consequently, all fields within an HS are treated as a singular node for transportation purposes. Given that field locations are highly dispersed, using fixed-resolution HS can lead to inaccurate transportation arcs. Such inaccuracies in spatial representation can result in sub-optimal network designs (See Figure 1).
The present work aims to reduce the computational complexity while maintaining data accuracy in network design models by introducing two alternative methods: composite curves and location-based clustering. Furthermore, we present a two-step optimization algorithm that decomposes large-scale network design problems into two smaller sub-problems that can be solved more efficiently. We demonstrate the effectiveness of these methods by conducting a case study, using real data, on the biofuels network design of the eight states of the US Midwest, including Illinois, Indiana, Iowa, Ohio, Michigan, Minnesota, Missouri, and Wisconsin.
Composite Curves:
To aggregate data from fields into HS without averaging out field-specific properties, we design a composite-curve-based approach. A composite curve depicts the relationship between two decision variables within an HS – such as land utilization versus biomass procurement – based on an optimized field selection order, which is determined using a ranking metric based on the objective of the network design model. For instance, with an objective to minimize land utilization, the ranking metric would prioritize fields based on their per-hectare biomass productivities. Then, when a biomass demand is assigned to an HS, the most productive fields are selected first for procurement, proceeding sequentially until the demand is satisfied.
This leads to a characteristic land utilization versus biomass procurement curve. The curve initially exhibits a steep slope due to the utilization of highly-productive fields. As less productive fields are eventually selected, the curve flattens out at the end. By employing a composite curve instead of an averaged productivity value for the HS, we are able to precisely capture the field selection decisions in network design models, since field-level optimization inherently seeks to utilize the most productive fields to achieve minimum land use.
As network design models often involve complex objective functions, we also develop a framework to determine the appropriate ranking metric. This involves systematically analyzing how biomass procurement decisions influence the overall objective function. Once these curves are established, we employ piecewise linearization to approximate them in order to maintain linearity in our model.
Location-based Clustering:
As an alternative to using fixed-resolution cells for network reduction, we employ location-based clustering to better assign fields to HS. Specifically, we choose the k-means algorithm, which partitions a dataset (fields) into a user-defined number k of distinct and non-overlapping clusters (HS) based on selected properties, such as spatial coordinates (longitude and latitude). The resulting transportation arcs are set to originate from the centroids, determined by the algorithm, of these HS. Since coordinates are the clustering properties, fields in the same HS are geographically proximate, ensuring that transportation arcs from these centroids are representative of the locations of member fields. In other words, the spatial representation of k-means generated HS is of higher quality than that of fixed-resolution HS.
Two-Step Algorithm:
We introduce a two-step algorithm that effectively solves large-scale network design models in high spatial resolution. Step 1 uses at least one of the aforementioned methods to efficient solve a “coarser” version of the model, while Step 2 takes in takes in some information from the first step results as input and solves a field-level model to obtain a highly granular and fully detailed network configuration. Step 2 also recovers the accurate transportation costs by using field-originating transportation arcs, which are then used to re-evaluate the total network costs (objective value) found in Step 1. A more detailed illustration of the algorithm can be found in Figure 2.
Results:
We use the proposed methods to analyze an integrated biofuels network to produce liquid cellulosic biofuels from switchgrass. Moreover, we use the definition of historically abandoned land by Lark et al. for the available land for biomass procurement [7]. Realistic, high-resolution data on the properties of these fields are determined using the Systems Approach to Land-Use Sustainability (SALUS) model [8]. Different combinations of the proposed methods are employed in order to assess how they impact model performance as well as solution quality.
Our model is implemented for various instances with different valuations of carbon emission. Preliminary results suggest that the use of composite curves noticeably enhances computational performance. Specifically, models with composite curves achieve shorter run times than models with field-level decision variables in approximately 75% of all instances. Location-based clustering allows for more accurate estimations of transportation costs, which is evident by the narrow differences between Step 1 and Step 2 transportation costs. In some instances, models with k-means HS find different optimal network configurations than those of models with fixed-resolution HS, while achieving better objective values. This highlights the effectiveness of location-based clustering in establishing HS that are more representative of the fields within them for transportation routing. A combination of the two methods leads to more accurate solutions along with more efficient run times.
In terms of system characteristics, we observe that as sustainability is valued more (higher carbon costs), the total network cost and carbon sequestration are increased. Additionally, model solutions show more dedicated facilities being establish in order to reduce far transportation distances. Lastly, we see a change in technology profiles, with more carbon capture technologies being chosen.
References:
- Demirbas A. Importance of biodiesel as transportation fuel. Energy Policy 2007;35:4661–70.
- Mielenz JR. Ethanol production from biomass: technology and commercialization status. Current Opinion in Microbiology 2001;4:324–9.
- O’Neill EG and Maravelias CT. Towards integrated landscape design and biofuel supply chain optimization. Current Opinion in Chemical Engineering 2021;31:100666.
- Sharara MA, Sahoo K, Reddy AD, et al. Sustainable feedstock for bioethanol production: Impact of spatial resolution on the design of a sustainable biomass supply-chain. Bioresource Technology 2020;302:122896.
- Ng RT, Kurniawan D, Wang H, Mariska B, Wu W, and Maravelias CT. Integrated framework for designing spatially explicit biofuel supply chains. Applied Energy 2018;216:116–31.
- Martin M, Taifouris M, and Gal´an G. Lignocellulosic biorefineries: A multiscale approach for resource exploitation. Bioresource Technology 2023;385:129397.
- Lark TJ, Spawn SA, Bougie M, and Gibbs HK. Cropland expansion in the United States produces marginal yields at high costs to wildlife. Nature Communications 2020 11:1 2020;11:1–11.
- Martinez-Feria R and Basso B. Predicting soil carbon changes in switchgrass grown on marginal lands under climate change and adaptation strategies. GCB Bioenergy 2020;12:742–55.