2025 AIChE Annual Meeting
(160g) Considerations for Achieving Target Resistance Values for Printed Resistors
Authors
Printing parameters for each ink were initially optimized to produce the most consistent layer on two substrates: glass and Kapton. Five-by-five-millimeter squares were printed and then cured using the supplier’s recommended conditions. Cured layer thicknesses were determined using a stylus profiler (KLA Tencor D500 Stylus Profilometer), along with an initial cross section characterization. Single lines were printed on glass and Kapton to assess the degree of spreading. Surface free energy (SFE) values on the glass and Kapton substrates were calculated from experimentally determined contact angle values and were found to be 86 and 51 mN·m-1, respectively, using the OWRK method.
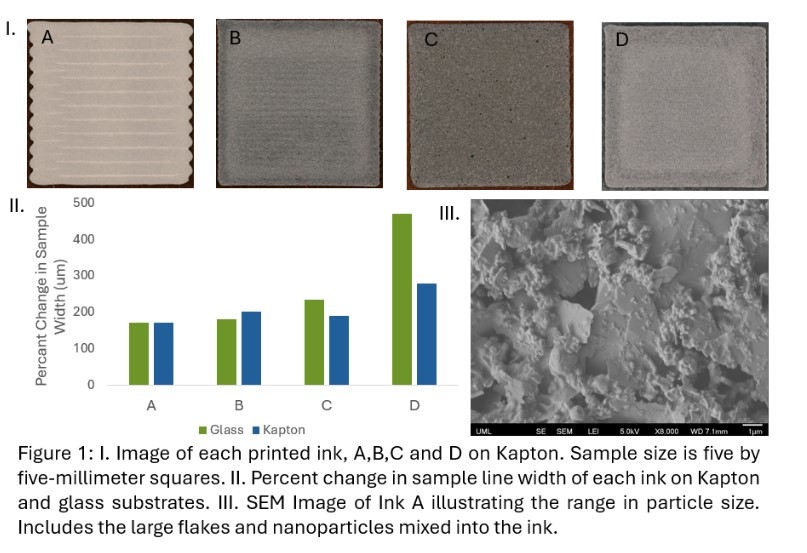
Ink D with the highest percentage increase in width (spreading) after the deposition of a single line using a 32-gauge needle showed a 450% increase on glass and a 275% increase on Kapton, which agrees with the surface free energy trends as shown in Figure 1 II. This ink also exhibited significant variation in surface topology despite having the lowest average particle size (40 nm; 10 to 20% wt carbon). This was attributed to the separation of the organic binders from the particles and uneven curing, which resulted in crater formation.
Ink A with the lowest degree of spreading on both substrates exhibited the greatest particle size variation, as observed through SEM imaging. This ink contained flakes up to a few microns in size mixed with nanoparticles as small as 60 nm. It was the only ink containing both silver (50 to 70%) and graphite (1 to 5%), whereas the other three inks were composed solely of carbon. Ink A also demonstrated the lowest resistivity, measured at 2.22 × 10⁻⁶ ohm·m. Interestingly, the printed and cured layer thicknesses for all the inks on glass were greater than those on Kapton, suggesting that further investigation is needed to understand the underlying mechanism. Additionally, the ink that most closely achieved the target resistance value of 200 ohms—measuring 213 ohms on Kapton and 209 ohms on glass—also exhibited the best nanoparticle distribution in SEM images.
This work highlights that several factors influence the printed layer thickness and resistivity of printed resistors. These factors include ink composition, printing and curing parameters, surface free energy (SFE), substrate material, and particle size. This is particularly important when working with commercially available resistive inks, where limited information is provided by the vendor.