2025 AIChE Annual Meeting
(499c) Colorimetric Visualization of the Breast Cancer Metastasis Based on the Size-Dependent Transport of Conjugated Polymer Nanoparticles
Introduction
Breast cancer is among the most prevalent malignancies in women. In breast cancer staging, the metastatic status of the sentinel lymph nodes (SLNs), the first few lymph nodes that directly receive lymphatic fluid drainage from the primary tumor, serve as an important indicator. Currently, SLN biopsy has been a gold standard for detecting SLN metastasis. The procedure involves injecting a tracer, such as a radioactive substance or blue dye, into the tumor to identify the location of SLNs, followed by their surgical removal for pathological evaluation. However, SLN resection can lead to side effects such as lymphedema, thus developing the SLN resection-free method is required. One of the ideal scenarios is that the tracer itself would possess the capacity to indicate the metastatic status of SLNs without resection.
To develop a resection-free SLN metastasis detection method, this study explores the use of a mixture of nanoparticles of several sizes as a tracer. Since the lymphatic microenvironment undergoes alternations during metastatic progression, including lymphatic vessel disruption and lymphangiogenesis[1,2], the size-dependency of nanoparticle accumulation in the SLN is also expected to change accordingly. Therefore, this size-dependent accumulation behavior in SLNs could serve as a novel indicator for SLN metastasis.
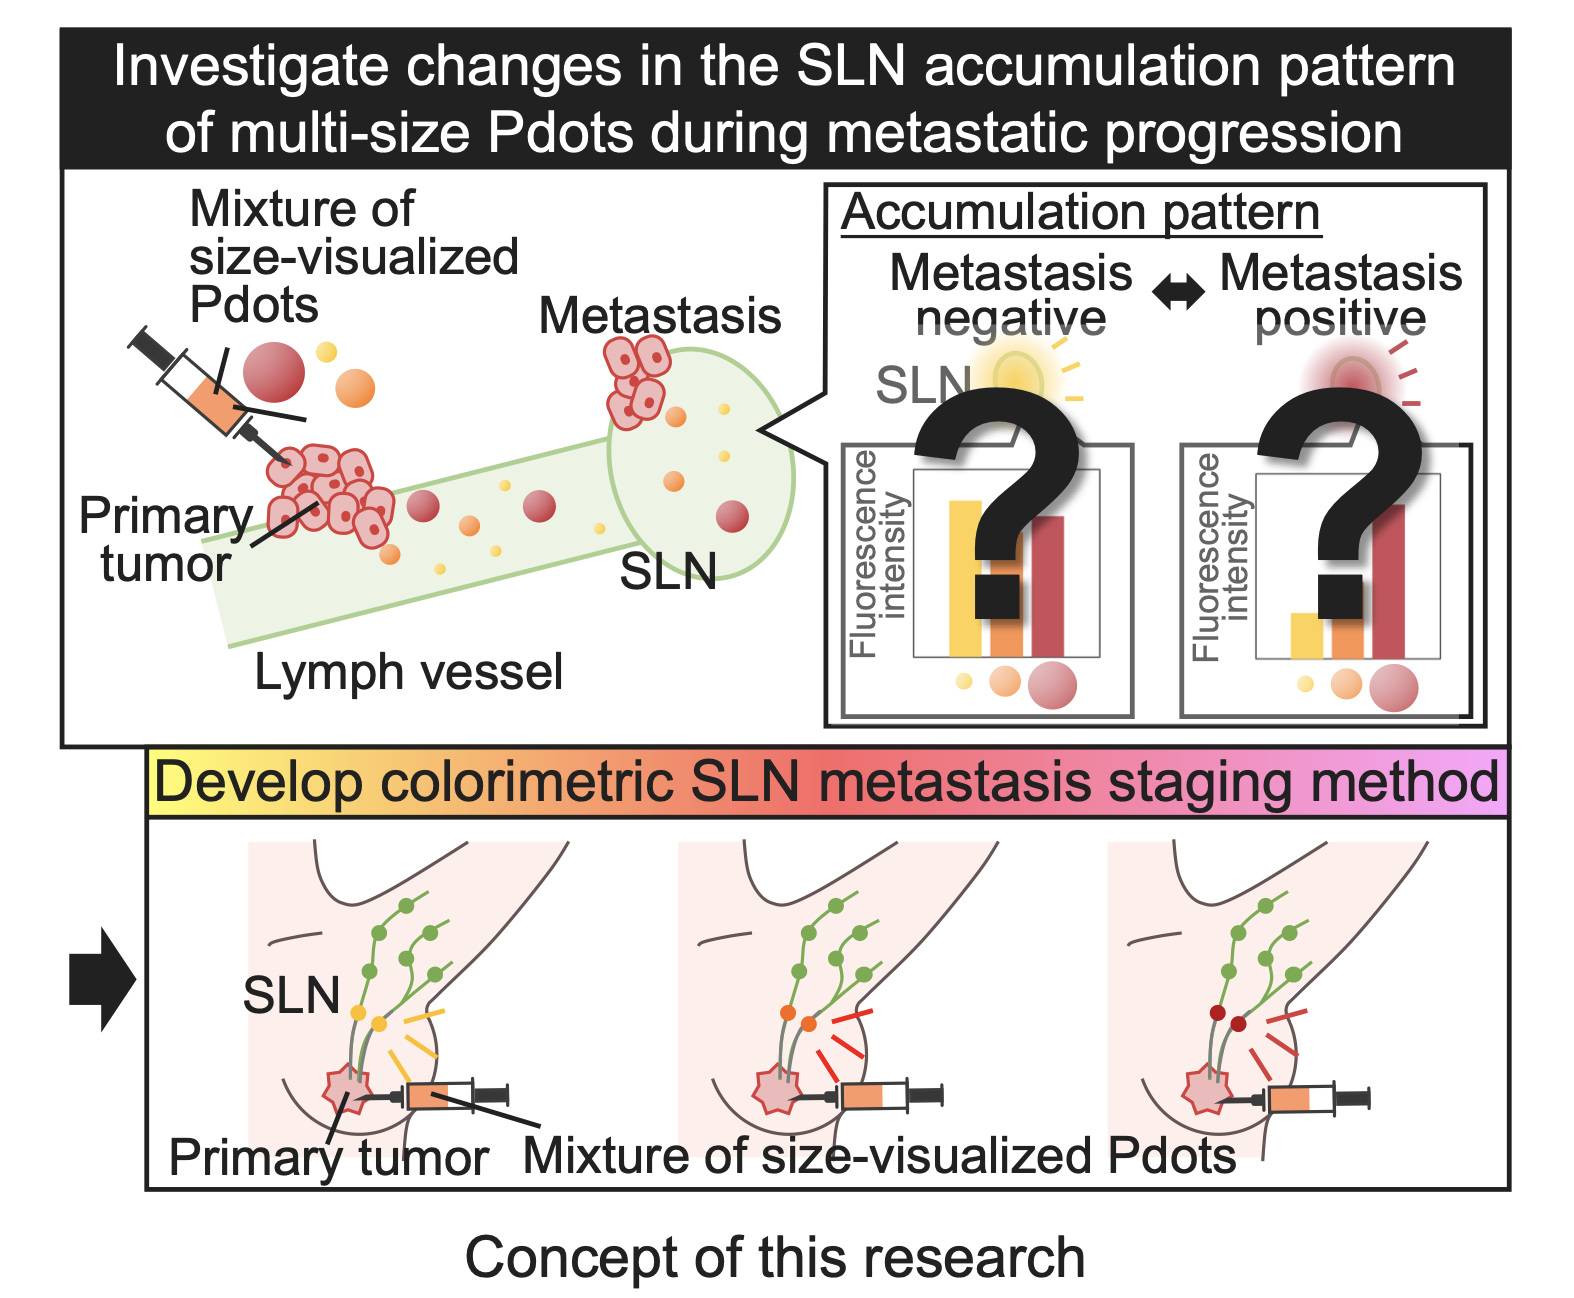
Furthermore, by utilizing nanoparticles with different fluorescent colors according to their size, the accumulation patterns of multi-size nanoparticles in the SLN can be easily visualized. For instance, if small and large nanoparticles are labeled with yellow and red, respectively, and injected together, more accumulation of small particles will result in a yellowish color, whereas more accumulation of larger nanoparticles will result in a reddish color. Thus, the colorimetric visualization of size-dependent nanoparticle accumulation pattern in the SLN using size-visualized nanoparticles mixture could become a novel method in which the tracer itself indicates metastatic status of the SLN. To achieve this, we employed conjugated polymer nanoparticles (Pdots), which have low cytotoxicity[3] and allow size tuning while maintaining fluorescence properties[4].
In this study, we aimed to investigate changes in the size-dependent Pdot transport in the lymphatic system and accumulation patterns in the SLN during metastatic progression. Based on the observed changes in the accumulation patterns, a novel colorimetric visualization method for SLN metastasis staging using size-visualized Pdot was aimed to be developed.
Experimental
1. Synthesis of size-visualized Pdots
Poly[(9,9-di-n-octylfluorenyl-2,7-diyl)-alt-(benzo[2,1,3] thiadiazol-4,8-diyl)] (F8BT) Pdot, poly[2-methoxy-5-(2-ethylhexyloxy)-1,4-phenylene vinylene](MEH-PPV) Pdot, tetraphenylporphyrin (TPP)-doped poly(9,9-di-n-octylfluorenyl-2,7-diyl)(PFO) Pdot were synthesized by a nanoprecipitation method using poly(styrene-co-maleic anhydride) as a stabilizing agent, and different volumes of pure water or acetic buffer containing 80 mM NaCl as the aqueous phase for size control as described previously[4,5]. The obtained Pdots were evaluated by transmission electron microscope (TEM) and fluorescence spectrometer. Then, the Pdots surface were modified with amine-terminated poly(ethylene glycol) (MeO-PEG-NH2, 5000 g/mol) by carbodiimide reaction between carboxyl groups on the Pdot surface and terminal amine groups of PEG chains, followed by the evaluation by Fourier transform infrared spectroscopy (FT-IR).
2. Establishment of a mouse SLN metastasis model
To evaluate changes in the SLN accumulation pattern of multi-size nanoparticles, the mouse popliteal lymph node metastasis model was established.4T1-Luc murine breast cancer cells (2×10⁵) were suspended in 20 μL of PBS and injected subcutaneously into the foot pad of 7-9 weeks old female Balb/c mice so that the popliteal lymph node on the injected side became the SLN. The SLN metastasis was evaluated by the weight measurement of the resected popliteal lymph nodes and hematoxylin and eosin (H&E) staining of sections.
3. In vivo and ex vivo imaging of size-dependent Pdot lymphatic transport
The mixture of PEG-modified F8BT Pdots, MEH-PPV Pdots and TPP-doped PFO Pdots (1.0 mg/mL in saline for each) subcutaneously injected into the foot pad of the healthy mouse (Balb/c, 9 weeks old, female) or the primary tumor of mice 1, 5 and 12 days after 4T1-Luc cell subcutaneous injection. At 2 hours after the Pdot injection, in vivo imaging of SLNs was performed using a digital camera under UV light irradiation. The SLNs were further resected and observed using an in vivo imaging system (IVIS) followed by spectral separation analysis to quantify the accumulation ratio of each Pdot. For statistical analysis, Hotelling's T2 test was performed among groups of SLN metastasis model mice 1, 5, and 12 days after cancer cell inoculation (n = 6 for each).
Results and Discussion
1. Synthesis and characterization of size-visualized Pdots
TEM image revealed that the obtained F8BT Pdots, MEH-PPV Pdots and TPP-doped PFO Pdots have average diameters of 27 nm, 55 nm, 108 nm, respectively. The maximum fluorescent emission peak of F8BT Pdot, MEH-PPV Pdot and TPP-doped PFO Pdot were 540 nm (yellow), 591 nm (orange) and 654 nm (red) respectively, and each Pdot exhibited a distinct fluorescent color under UV light irradiation. Moreover, the success of the PEG modification on Pdots was confirmed by FT-IR measurement of Pdot after modification. These results illustrated three types of PEG-modified Pdots, which could use their fluorescence color as an indicator of size, were successfully synthesized.
2. Establishment and evaluation of a mouse SLN metastasis model
H&E staining revealed that there were no cancer cells in the popliteal lymph node of healthy mice, whereas cancer cells were observed in the popliteal lymph node of mice injected with 4T1-Luc cells, confirming the successful establishment of a mouse SLN metastasis model. Furthermore, the weight of SLN increased over time following 4T1-Luc cell injection. Given that SLNs typically enlarge as tumor metastasis progresses, these results indicate the successful development of a mouse model that represents different stages of cancer metastasis.
3. Visualization of size-dependent Pdot lymphatic transport for the SLN metastasis staging
2 hours after the Pdot mixture injection, the popliteal lymph nodes of living healthy mouse and SLN metastasis model mouse showed different fluorescent colors, yellowish and reddish, respectively, under the UV light irradiation, indicating that the size-dependence of Pdot accumulation changed according to the SLN metastasis. In addition, the fluorescence intensities of each Pdot accumulated in the popliteal lymph node were analyzed by spectral separation of IVIS images taken after the resection. In the healthy mice, the smaller Pdots accumulated to the popliteal lymph node more, resulting in the yellowish color. This result is consistent with the previous report that smaller nanoparticles diffuse more easily from the site of administration to the lymphatic vessels and accumulate in the nearest lymph node[6]. On the other hand, the SLN metastasis model mice showed the opposite size dependence that the larger Pdots accumulated to the SLN more to the popliteal lymph node. Since cancer cells disrupt lymphatic vessels during cancer infiltration[7], leakage of nanoparticles from lymphatic vessels is expected to alter their transport phenomena in the lymphatic system. In the SLN metastasis model mouse, fluorescent signal was observed in an area away from the expected Pdot transport route, suggesting the leakage of Pdots from lymphatic vessels. From these results, it was hypothesized that small Pdots were more likely to leak from the disrupted lymph vessel, resulting in greater accumulation of larger Pdots in the SLN.
The above experiments demonstrated the identification of SLN metastasis by size-visualized Pdots. It was further expected that the accumulation patterns of size-visualized Pdot in the SLN would also change according to the degree of metastatic progression. Hence, then we aimed to extend this colorimetric SLN metastasis visualization method for staging. The resected SLN of mice injected with Pdot mixture showed different fluorescent color, yellowish, orangish and reddish, depending on the time point after the cancer cell inoculation, 1, 5, and 12 days, respectively. The fluorescence intensity ratio of each Pdot accumulated in the SLN, calculated by spectral separation of IVIS images, was also consistent with the observed fluorescence color. Furthermore, the size-dependent Pdot accumulation pattern in the SLN was significantly different between day 1 and day 5 (p < 0.01), as well as between day 5 and day 12 (p < 0.001) after cancer cell inoculation. It was suggested that the accumulation pattern of size-visualized Pdots could also be used as an indicator for cancer staging.
Conclusions
Three types of size-visualized Pdots were successfully synthesized and modified with PEG. By injecting a mixture of synthesized Pdots into the SLN metastasis mouse model, it was found that the size-dependent accumulation of Pdots in lymph nodes changed depending on the metastatic progression. The size-dependent Pdot accumulation pattern in the SLN, which can be easily visualized as fluorescent color, is expected to be utilized as a novel indicator for breast cancer staging.
Acknowledgements
This work was supported by JSPS KAKENHI and “Advanced Research Infrastructure for Materials and Nanotechnology in Japan (ARIM)” of the Ministry of Education, Culture, Sports, Science and Technology (MEXT).
References
[1]Karaman, S. et al. J Clin Invest 124, 922–928 (2014). [2] Chen, Y. et al. Lymphology 32, (1999). [3] Wu, C. et al. Angew Chem 52, 3086–3109 (2013). [4] Nakamura, N. et al. RSC Adv 12, 11606–11611 (2022). [5] L. Grimland, J. et al. Nanoscale 3, 1451–1455 (2011). [6] Oussoren, C. et al. Biochim Biosphys Acta 1328, 261–272 (1997). [7] Niimi, K. et al. Oral Oncology 37, 357–364 (2001).