2025 AIChE Annual Meeting
(703c) Can Market-Based Interventions Commercialise CCS and Blue Hydrogen for Deep Decarbonisation? – USA Case Study
Problem
The United States of America (USA) has committed to achieving net-zero emissions by 2050, a target formalized in its 2021 Long-Term Strategy to the United Nations Framework Convention on Climate Change, emphasised in their 2035 nationally determined contributions (NDC) (UNFCCC, 2022). In 2022, the Inflation Reduction Act (IRA) was enacted by the Biden Administration by allocating 369 billion USD for clean energy among which hydrogen hubs (UNCTAD, 2022). This strategy involved federal carbon capture tax credit for enhanced oil recovery (EOR) and storage, namely the 45Q tax credit with a value of 85$/t and 60$/t, respectively, and the 45V tax credit for clean hydrogen production. The former investigates proposing a portion of the US Internal Revenue Code to incentivise carbon capture and storage, thus stirring much debate among political, energy and environmental circles (Gilmour, 2023). In fact, this strategy provides an important leap into making fossil fuels combustion less carbon-intensive, a middle ground in the current geopolitical atmosphere in the country. The financial endorsement of this technology represents a boon of sustainability within the US economy as it contributes, aside from decreasing carbo emission, to preserving and creating more than 1.8 million clean jobs (Gilmour, 2023). On the other hand, the 45V tax credit is the largest clean energy subsidy where renumerations for clean hydrogen productions involve a vale of 1$ to 3$/kg (Grubert et al., 2025). This financial focus is accompanied by a tailored pragmatic approach to decarbonising key sectors among which several hard to abate industries. Among the major industries subject to deep decarbonisation are the chemicals industry (notably ammonia and methanol), iron and steel and cement (Rissman et al., 2020). Indeed, total emissions value in the United States reached a value of 6343.2 million metric tonnes of CO2 (million MtCO2) with industry occupying 30% of these emissions (EPA,2025). Additionally with the growing interest in the development of a “hydrogen economy”, there should be no delay to concretise the role of both ammonia and methanol as hydrogen carriers where economies are “reasonable”, flag shipped by the United States (Bockris, 2013). In that light, carbon capture and storage (CCS) combined with natural gas to decarbonise these industries and produce blue hydrogen through steam methane reforming (SMR) presents itself as an interesting opportunity to enhance decarbonisation while ensuring energy security. Therefore. this work will investigate answering the following question: can U.S. market-based mechanisms such as the 45Q and 45V tax credits, alongside emerging policies, generate sufficient demand-pull to commercialise CCS and blue hydrogen in the domestic ammonia, methanol, cement, and steel industries?
Methods
The methodology involves developing ex-post market penetration assessment model by integrating CCS in different industries. The model involves a calculation of the cost of the commodity under different market-based policies and different annual reduction rates, across different states where they are present. The model is applied to 56 ammonia plants, 13 methanol plants, 109 cement plants, and 10 integrated iron and steel plants. The first part of the work involves providing an individual, tailor made and industry-specific answer to the following question: “Can current market-based mechanisms encourage the uptake of CCUS and blue hydrogen and reaching NetZero in the US? If so, when is a positive economic tipping point achieved?”
To conduct this analysis, three different scenarios involve a homogeneous annual reduction rate of 3%, an incremental annual reduction rate of 1% to 5% until 2030 and 2050, respectively, and a heterogeneous annual reduction rate from 1% until 2030 and 5% until 2050. Since the IRA has a lifespan stretching until 2030, therefore, a projection until 2035 will only be consider for the states of California and Washington, where both have an ETS value, applicable for some sectors. These values for the annual reduction rate are conclusively drawn from many studies concentrating on the potential annual reduction rates where the National Energy Technology Laboratory (NETL) (2014) has estimated that an annual reduction rate of 20-30% can be achieved over a decade. This same percentage is reiterated by Evans (2021) with a decrease from 20% to 25% by 2050.
On the other hand, the implications will be inspected form the lenses of recipient countries in trade relations with the United States. This step is fundamental to channel potential recommendations based on lessons learned for future endeavours.
Results
The completed ex-post analysis explicitly concludes that without any governmental intervention, there is hardly cost parity achieved for any industry. When looking into the dispersion of the market-based policies across different sectors, distinct conclusions can be drawn for different industries:
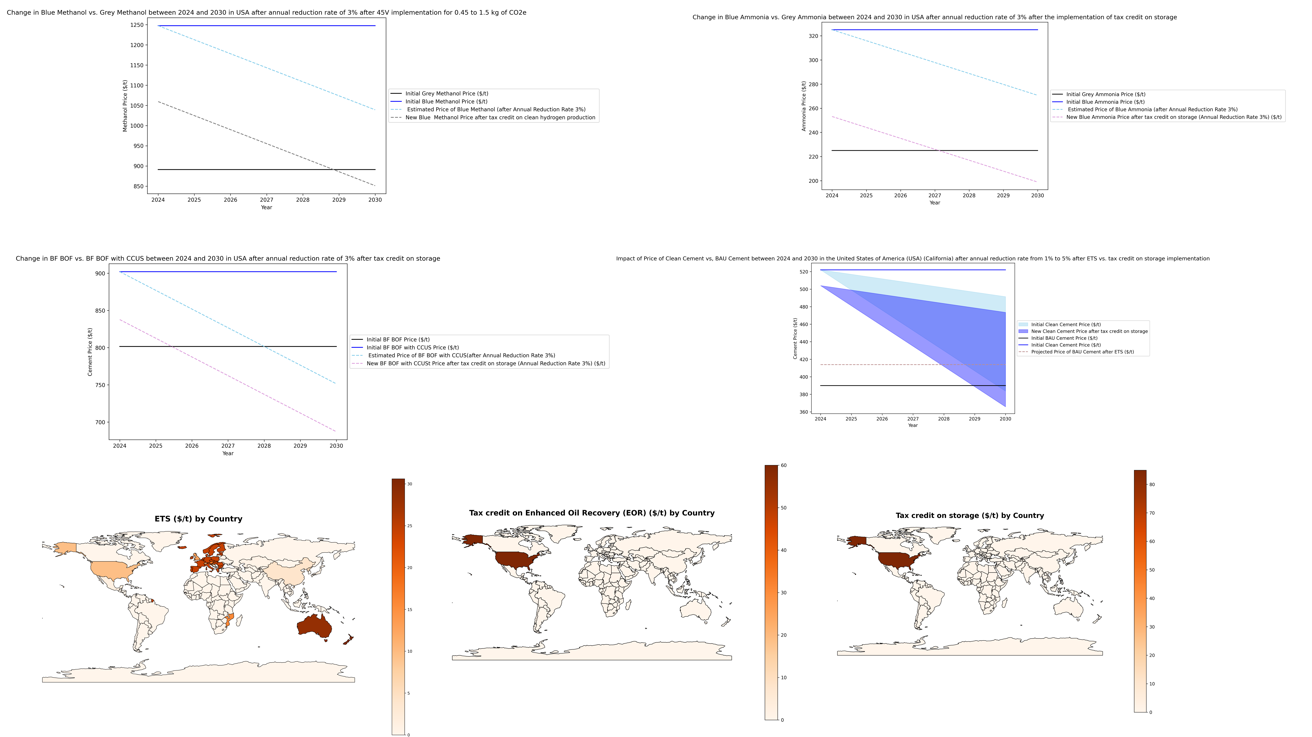
- In the case of blue ammonia production, the United States of America occupies the lion’s share with a production capacity reaching approximately 90 million Mtpa. Therefore, a technology uptake in the US will influence other producers relying on SMR and CCS. Currently, 45Q tax credit is effective in reaching cost parity between blue ammonia and grey ammonia.
- Blue methanol, carrying 40% cost premium over fossil fuel methanol remains lacking behind in terms of cost parity. The 45V tax credit depends highly on the percentage of CO2 captured during operations, thus linking capacity cost to efficiency, and therefore credit proposed by the government. Indeed, current captured rate is estimated (when not provided) at 65%. With capture cost holding the majority of the technology cost across the supply chain, an additional cost burden can be imposed on industrials, thus creating additional strain on the marketability of the technology. For 0.45-1.5 kg of CO2e the 45V tax credit allows for the achievement of a positive tipping point around 2027 given that the annual reduction rate is high with a value of 5%. On the other hand, a negative outlook towards the technology, driven by low deployment, will not lead to technology push, rendering the policy inefficient. Therefore, there is a duality between industrials decarbonisation endeavours and investments and governmental intervention.
- Due to the high cost of CCS for cement in the United States with a value of 132 $/t, the implementation of 45Q tax credit on both storage and EOR will significantly decrease cost until a minor gap of 10$/t without reaching a positive tipping point, given the annual reduction rate is 3%. For California, specifically, when the 45Q tax credit is combined with the emissions trading scheme (ETS) introduced in the state, a positive tipping point is achieved for an annual reduction rate towards 2029. It is only when an annual reduction rate of 5% is implemented that a positive tipping point is reached that clean cement can reach positive cost parity towards the end of 2029. A similar conclusion can be drawn from the state of Washington, where 2028/29 seems the year where a positive tipping point is achieved, with results encouraging to extend the lifespan of the policy.
- In the case of integrated steel plants, two different technologies are paralleled. On one hand, blue hydrogen-based steel remains on average 30% more expensive than blast furnace deployment. For steel plans involving electric arc furnace (EAF) and subject to 0-0.45 kg of CO2e, the 45V tax credit allows for current cost parity. A similar result is observed in 2029 for plants emitting 0.45-1.5 kg of CO2e.
Learning from these conclusions, the USA has been effective driving down the cost of clean industries where CCS is a low-hanging fruit with results observed before the end of the policy lifespan, around 2027-2029. Conclusively, these mechanisms provide sufficient foundation to scale up investments in CCS and blue hydrogen. However, they are highly fluid and non-durable, where, subject to political instability must be accompanied by robust, long term incentives. Indeed, with a change in the current political atmosphere, the US positions on the level of international regulations, notably with regards to Article 6 and carbon markets can rely on such immediate consequences to manage expectations and mitigate investment risks and uncertainties.
Implications
This study is the first to gradually conduct analysis from national/state level to plant level, looking at the implications of market-based policies for industrial decarbonisation in the United Sates. The work will, first, can inform U.S. policymakers, federal and state agencies, investors, and industry stakeholders about the potential and limitations of current market-based mechanisms. Second, this study involves international climate finance institutions and think thanks on potential derisking structures to overcome infrastructure constraints and political instabilities. Finally, it transcends to climate negotiators in international agencies and United Nations observer organisations, focusing primarily on USA climate policies and carbon markets, notably Article 6 of the Paris Agreement, to align their ambitions with current trends. Therefore, this work contributed to the academic discourse around positive tipping points on climate mitigation technologies, highlighting how policies catalyse CCS deployment as a technology of interest in the quest of heavy decarbonisation.
References
Bockris, J. O. M. (2013). The hydrogen economy: Its history. International Journal of Hydrogen Energy, 38(6), 2579–2588. https://doi.org/10.1016/j.ijhydene.2012.12.026
Environmental Protection Agency. (2025, March 31). EPA. https://www.epa.gov/ghgemissions/sources-greenhouse-gas-emissions
Evans, M. (2021, September 28). Carbon capture and storage: How far can costs fall?. Wood Mackenzie. https://www.woodmac.com/news/opinion/carbon-capture-and-storage-how-far…
Gilmour, J. (2023). 45Q: Toward a stronger Federal Carbon Capture Tax Credit. Environmental Claims Journal, 35(3), 235–253. https://doi.org/10.1080/10406026.2023.2252375
Grubert, E., Ricks, W., & Cullenward, D. (2025). Greenhouse gas offsets distort the effect of clean energy tax credits in the United States. Environmental Research: Energy, 2(1), 015001. https://doi.org/10.1088/2753-3751/ad9f65
NETL experts to discuss use of hydrogen-fueled turbines to drive clean energy economy. netl.doe.gov. (2014). https://netl.doe.gov/node/12058
Rissman, J., Bataille, C., Masanet, E., Aden, N., Morrow, W. R., Zhou, N., Elliott, N., Dell, R., Heeren, N., Huckestein, B., Cresko, J., Miller, S. A., Roy, J., Fennell, P., Cremmins, B., Koch Blank, T., Hone, D., Williams, E. D., de la Rue du Can, S., ... Helseth, J. (2020). Technologies and policies to decarbonize Global Industry: Review and Assessment of Mitigation Drivers through 2070. Applied Energy, 266, 114848. https://doi.org/10.1016/j.apenergy.2020.114848
UNCTAD. (2022, August 16). United States of America - $369 billion in investment incentives to address energy security and climate change: Investment policy monitor: UNCTAD investment policy hub. https://investmentpolicy.unctad.org/investment-policy-monitor/measures/….
THE UNITED STATES OF AMERICA NATIONALLY DETERMINED CONTRIBUTION. Unfccc.int. (2022, June 2). https://unfccc.int/documents/498019