2024 AIChE Annual Meeting
(39f) An End-to-End Machine Learning Framework for the Characterisation of Tablet Disintegration
Author
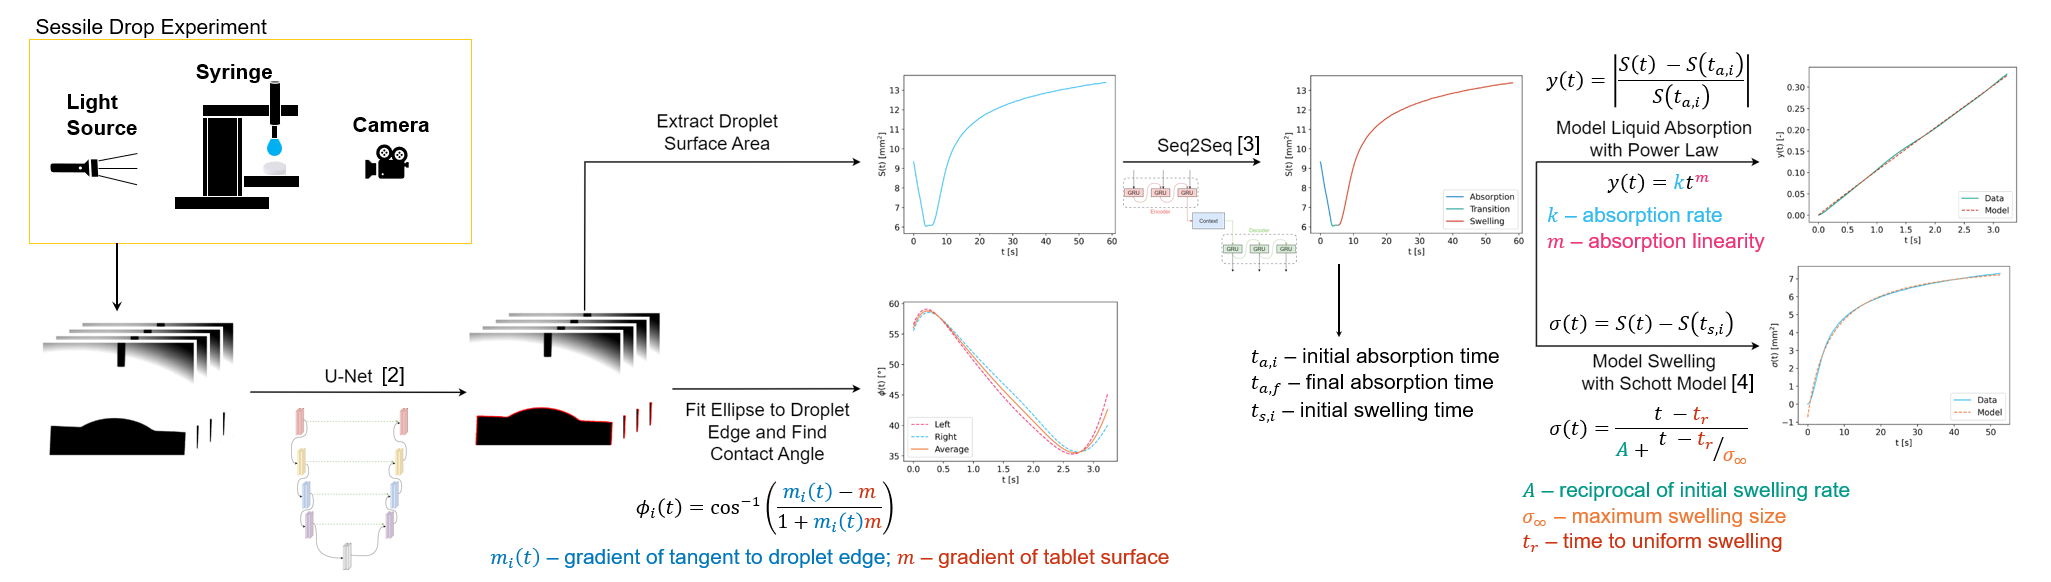
The frames of the video constitute the experimental data with image segmentation employed to locate the droplet and tablet construct in each frame for further analysis. This is done by training a U-Net neural network. The U-Net works as a per-pixel classifier, trained by minimizing the linear combination of the binary cross entropy (BCE) and Sørensen-Dice coefficient (SDC) losses. The BCE determines how confident the U-Net is in its prediction of the classifications while the SDC loss is a measure of similarity between the ground-truth and predicted segmentations. This is implemented in PyTorch and trained for 18 epochs until convergence across 4 NVIDIA H100 GPUs.
Once the droplet has been identified in each frame, the surface area and contact angles are extracted from the frame. The surface area is simply a summation of the number of pixels in the droplet multiplied by the physical area of one pixel. The contact angle is found by identifying the edge of the droplet, fitting an ellipse, and finding the gradients of the points where the fitted ellipse crosses the smoothed tablet surface. The angle between the gradient and the tablet surface is then easily calculated. The extracted data are then the surface area at each time , S(t), and the contact angle, Φ(t).
To characterise the absorption and swelling processes from the surface area, three key timepoints need to be identified: the absorption start time, t_a,i; the absorption end time, t_a,f; and the swelling start time t_s,i. t_a,i is obtained by locating a maximum turning point in as this will be present where the droplet comes into contact with the tablet and signifies the beginning of liquid absorption being the dominant process.
To obtain, t_a,f and t_s,i, the surface area profile is processed by a Sequence to Sequence (Seq2Seq) neural network. The Seq2Seq model works as an autoencoder which classifies each point in the surface area profile as being during the liquid absorption, transition and swelling phases based on information from the previous timepoints. It is trained on all available formulations’ data and validated against unseen formulations achieving 96.71% accuracy. Most of the confusion in this model comes from estimating the start of the swelling phase sooner than the manual labelling did but this is not thought to have much effect on the model results. Once all three times are obtained, the surface area can be split into absorption and swelling with mechanistic models fitted to each.
The liquid absorption, y(t), is quantified as the absolute relative change of the surface area at time, t_a,i (equation shown in attached figure) and modelled with a power law function to determine the liquid absorption rate, k, and the absorption linearity, m, of the tablet. The swelling, σ(t), is expressed as the change in surface area from the value at time t_s,i. This is modelled using the Schott equation (shown in attached figure) giving three values characterising the swelling – A, the multiplicative reciprocal of the initial swelling rate, σ_∞, the maximum swelling size and t_r, the time delay before the swelling becomes uniform.
This fully automated workflow allows for the rapid, robust analysis of large datasets accelerating understanding of the absorption and swelling processes of tablets. On a modest GPU (NVIDIA RTX A6000), the workflow achieves a 360x speedup over traditional image processing used in previous studies. This takes the analysis from requiring hours of compute per video to full analysis in less than one minute. This has been used to analyse a large dataset of tablets (200) containing the API griseofulvin to compare how the addition of an API changes the disintegration time of tablets. All tablets contained 30% w/w of API, 5% croscarmellose sodium, 1% magnesium stearate and the evenly split between two excipients. For the tablets with dissolution controlled disintegration, the presence of API weakens the correlation between disintegration time and absorption linearity while for wettability controlled formulations the correlation is much the same. Swelling controlled formulations have a more extreme reaction to the API with both liquid absorption parameters changing their correlation signs while still maintaining similar magnitudes. This demonstrates that at high drug loading, there is a great effect on the disintegration performance of dissolution and swelling controlled formulations while wettability controlled formulations behave much the same regardless of API presence.
Another application of this approach is the integration into a fully automated tabletting microfactory. The microfactory consists of a bespoke dosing unit, near-infrared spectral analysis for content uniformity, compaction simulator, hardness tester and bespoke sessile drop apparatus. The products are transferred between the stations via robotic arms. The sessile drop analysis has been optimised to run on an NVIDIA Jetson AGX Orin Development Kit using NVIDIA’s TensorRT framework. This implementation works in real-time (max. performance 45FPS) at low power (50W) to analyse sessile drop videos as soon as they are available. The results from the model fitting are combined with modelling approaches of the other instruments into a global Bayesian optimisation so that the setup can work towards achieving a user-defined target e.g. specific tablet porosity or disintegration time.