2024 AIChE Annual Meeting
(347d) Deep Learning Particle Characterisation for Efficient Automatic Thermodynamic and Kinetic Parameter Estimation
Authors
At CMAC, a prototype automated small-scale screening platform has been developed. Based on proof-of-concept workflow developed previously at CMAC [1]. This will be used to investigate API and solvent systems, obtaining solubility and kinetic parameter estimates with minimal material wastage. The system is based on a set of 6 small scale crystallisers (Technobis Crystalline 2). Each instrument contains 8 reactors so totalling 48 small scale (8ml) reactors equipped with in-situ microscopes, temperature control, and stirring. Cooling crystallization experiments are automatically performed and repeated. Vials of API and solvent are prepared by separate dosing platform and placed in the reactor by collaborative robots. There are two main experiments performed: solubility estimation and kinetic parameter estimation experiments. Each experiment, including 5 temperature cycles, takes approximately 24 hours. Across 48 reactors and accounting for downtime, this gives approximately 200 experiments per day. Data is analyzed on-the-fly and stored in a database following FAIR principles (data should be Find-able, Accessible, Interoperable, and Reusable).
This paper focuses on the on-line analysis of the in-situ imaging. From each reactor, up to 5 images per second are measured (240 image/s in total). The images are analyzed using state of the art Deep Learning (DL) models to (1) classify the images based on their contents and (2) identify particles.
The image classification stage is used to detect clear points (when particles are all dissolved during heating) and cloud points (when particle nucleate during cooling). These values are important for solubility experiments as they are used to give an estimate of solubility and meta stable zone width (MSZW). These solubility and MSZW measurements are validated against another transmissivity-based method and against manual interpretation of image data. Additionally, the model is used to decide if the image needs to be segmented at all - it is a waste of computational resources to analyze an empty image. A ResNet [2] model is employed for performing this classification. Each image is classified based on whether it contains particles or not, whether it is too dense to tell, and the shape or habit of the particles if they are present. The model was trained on a dataset of over 75k images, labelled using an in-house tool. The model obtains F1 scores of over 80% across all classes.
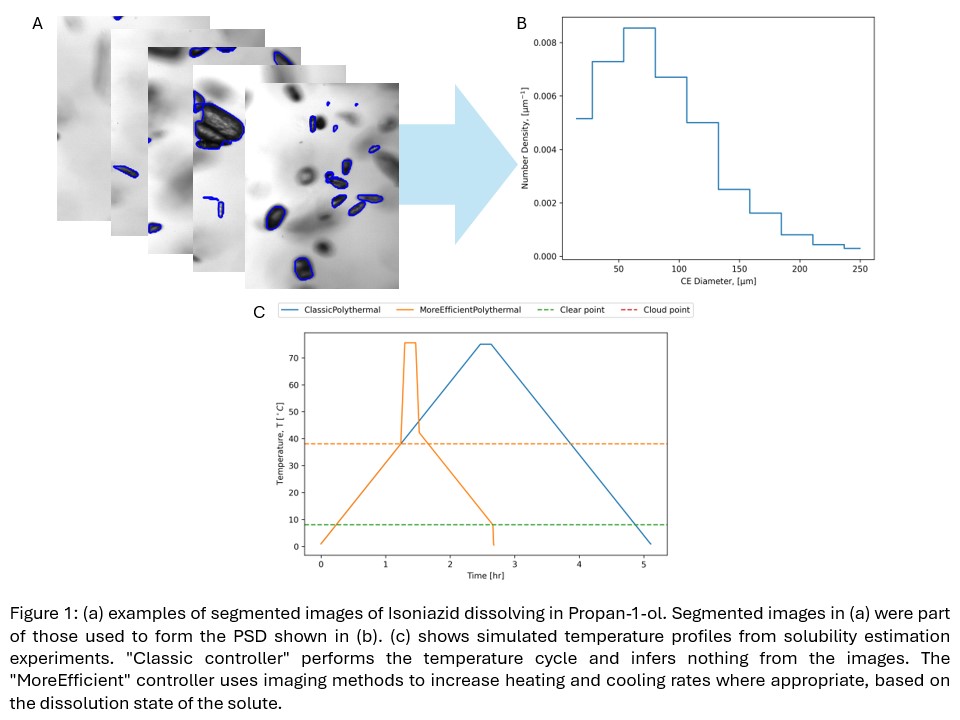
The image segmentation stage employs a deep learning model, YOLOv8 [3], to perform instance segmentation to identify particles. Identified particles are counted and sized and a Particle Size Distribution (PSD) is formed. The PSD is tracked in time to give growth rate and nucleation rate estimates. The model was trained on a relatively small dataset of only 300 images, obtaining mean-Average Precision (mAP) values close to 70%. This segmentation is highlighted in Figure 1A - showing some examples of segmented images. Detected particles are outlined in blue. Particle sizes are collected to form the PSD in Figure 1B.
On-line image analysis is used to efficiently control the experiment. As mentioned, this is used to target the application of heavyweight DL models to save energy. Additionally, there is time and energy to be saved by ending experiments early, once the objective is achieved. Ordinarily, these automated experiments are run for a set time period - following a temperature profile. With live image analysis and flexible control software the experiment can be updated on-the-fly depending on the needs of the experiment. For example, when performing solubility estimation experiments: we do not need to keep heating slowly if the particles are already dissolved, the temperature can be rapidly raised to save time; we do not need to cool once cloud point has already been achieved. This effect is shown in Figure 1C: in the simulated experiment we can save several hours off a single cycle.
- Pickles, T., Mustoe, C., Brown, CJ., Florence, A. (2022) BJP, doi:10.5920/bjpharm.1128
- He, K., Zhang, X., Ren, S., Sun, J. (2015) arXiv, doi:10.48550/arxiv.1512.03385
- Reis, D., Kupec, J., Hong, J., Daoudi, A. (2023), arXiv doi:10.48550/arxiv.2305.09972