1. Introduction
During mixing operations, the flow pattern in the stirring blade turning space significantly influences the tank circulation flow, directly impacting the success or failure of the operation. However, accurately measuring the flow pattern in this space is challenging, leading to insufficient understanding of it. This issue is particularly pronounced when scaling up medium viscosity fluid mixing operations, as the flow that was laminar flow observed at laboratory scale may become a transitional regime at industrial scale. This transitional regime exhibits characteristics of both laminar and turbulent flows. Despite the significance of understanding transitional flow for equipment design, the flow pattern in this regime remains unclear.
In this study, the Reynolds number was varied from laminar flow to the transitional regime. The three components of instantaneous velocity in three dimensions within the stirring blade turning space were measured using tomographic stereo-particle image velocimetry (TS-PIV) at instantaneous values. The velocity information obtained was then converted to a rotational coordinate system using the MATLABⓇ program. Subsequently, the three-dimensional flow state of the flow in the transitional regime, where the laminar and turbulent parts are mixed, was investigated.
2. Experiments
A non-baffled cylindrical stirred vessel with a flat bottom, having an inner diameter of T = 0.20 m was utilized. The impeller, a six-bladed paddle, had a diameter D and blade width b of 0.067 m and 0.013 m, respectively. Both the six-bladed paddle and the vessel were constructed of PMMA. Other specifications and conditions were as follows: liquid depth H was 0.20 m, impeller height h was H/2, the impeller rotational speed N was 2 s-1, the impeller tip speed (vtip = πND) was 0.420 m/s. Glycerin aqueous solution was used as the working fluid. PIV measurements were conducted at various Reynolds numbers (Re = ND2/μ) of 13, 221, and 445 by adjusting the viscosity μ and density ρ of the glycerin solution. The solution viscosity was μ = 0.857,0.0486, and 0.0237 Pa s respectively. A volumetric laser with a wave length of 532 nm and a power of 2 W (Flowtech research Inc.) was employed to visualize the tracer particles to capture. Tracer particles (emission wavelength of 589 nm, diameter of 5 μm, and density of 1050 kg/m3; Thermo Fisher Scientific Inc.) were utilized. Their concentrations ranged from 6–7 mg/L and were adjusted to ensure 5–10 particles in the interrogation window. The height of the blade center was designated as z = 0, and measurements were taken for z = 0 ~ − 2.5 mm and z = − 2.0 ~ − 4.5 mm. Four high-speed video cameras (FASTCAM-mini AX200 and AX100; Photron Ltd.) were used to capture images of 33 mm × 33 mm square from the bottom of the stirred tank for 5.46 s at a capture rate of 4000 fps and a shutter speed of 1/16000 s. To mitigate the impact of refractive index mismatches between the fluid and PMMA on image quality, the tank bottom was designed in a pyramidal shape with a 20-degree angle, aligned parallel to the four camera lens faces.
3. Analytical method
The calculation grid size was 5 × 5 pixels. The size of the interrogation window was 15 × 15 pixels. The three-directional fluid velocities in the Cartesian coordinate system: ux, uy, and uz were obtained using PIV analysis software (FtrPIV and TS-FtrPIV; Flowtech Research Inc.). Time-averaged radial, circumferential, and vertical velocities: ūr,ro, ūΘ,ro, and in a rotating coordinate system were calculated using the MATLABⓇ program. The ensemble-averaged discharge flow rate at the impeller tip position defined by Eq. (1) were calculated for each cross section.
〈ur,ro|r=D/2〉=∫2π (ūr,ro|r=D/2)/2π dΘ (1)
4. Results and Discussion
4.1 Changes of distribution of three velocity components with Reynolds number
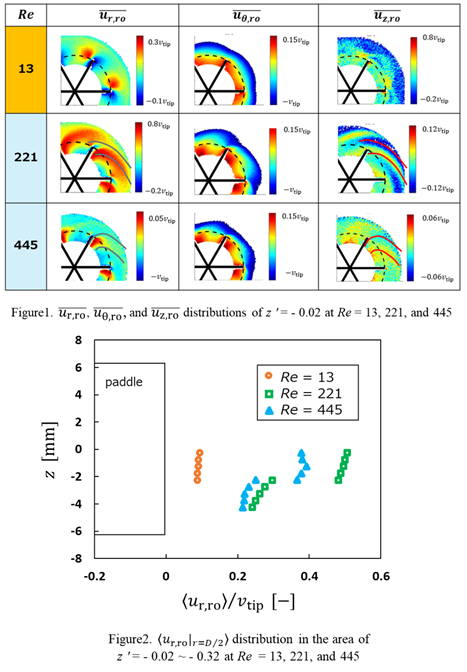
Figure 1 shows the distribution of ūr,ro, ūΘ,ro, and ūz,ro at z ' (= z/b) = − 0.02 at Re = 13, 221, and 445. Figure 1 illustrates that the discharge flow region (region of large positive ūr,ro) moves from the front side of the blade to the back side of the blade as transitioning from Re = 13, which is laminar flow, to Re = 221, which is the transitional regime. At Re = 13, it can be confirmed that the ūr,ro is positive on the front side of the blade and negative on the back side. Therefore, it can be seen that a horizontal flow was formed around the blade tip from the front of the blade to the back of it. At Re = 221 in the transitional regime with high viscus, the positive ūz,ro on both the front and back of the blade is integrated to form a wide discharge flow area indicated by gray in ūr,ro contour and red lines in ūz,ro contour. At Re = 445 in the transitional regime with low viscous, the vortex structure consists of the negative ūz,ro and the positive ūz,ro distribution behind the blade can be seen (red lines in ūz,ro contour). This pair of ūz,ro distribution forms the discharge flow on the back side of the blade indicated by gray lines in ūr,ro contour.
4.2 Distribution of discharge flow at various Reynolds
Figure 2 shows the distribution of discharge flow, 〈ur,ro|r=D/2〉 at the impeller tip position in the area of z ' = − 0.02 ~ - 0.32 at Re = 13, 221, and 445. Figure 2 shows that the discharge flow was small at Re = 13 (laminar flow), reaches a maximum at Re = 221 (transition regime), and decreases at Re = 445. At Re=221, the flow rate reaches a maximum due to the development of the discharge flow both behind and at the front of the blade. At Re=445, the discharge flow rate decreases because the vortex structure behind the blade was developed, and the discharge flow region became narrow.
5. Conclusion
This study quantifies the three-direction flow velocity distributions in a stirring blade turning space in a non-baffled vessel from a laminar to a low-viscosity transition regime using TS-PIV. The results showed that the discharge flow region moved from the front side of the blade to its back side while changing from a laminar to a transitional regime from Re = 13 to 445. In addition, the relationship between ūz,ro distribution and the discharge flow region was clarified in the transitional regime.
Acknowledgements
This study received partial support from Grant-in-Aid for Scientific Research (No. 22K04799) from the Ministry of Education, Culture, Sports, Science and Technology of Japan.